¿Puede HYPE batir máximos con la entrada de instituciones en ETFs de Hyperliquid?

Sentimiento de IA: 78/100 Alcista
Esta puntuación se genera mediante un análisis impulsado por IA del contenido del artículo.
con tecnología de
Comprar HYPE. El artículo muestra una demanda institucional renovada vía entradas hacia THYP/BHYP/HYPG, con los activos netos totales de los ETF en aumento y un volumen acumulado cercano a $900M. La acción del precio está en una clara tendencia alcista (por encima de las EMAs de 50/100/200 días agrupadas) y los toros apuntan a una ruptura por encima de $75.76. Si la supera, la siguiente zona al alza está entre $83.63 y $94.83.
Riesgo clave: Las entradas en ETFs se detienen y HYPE cae por debajo de la zona de soporte de $63, convirtiendo la tesis de ruptura en un rally fallido.
Comprar exposición a ETFs de HYPE (preferir el más líquido entre THYP, BHYP y HYPG). La ventaja principal es la continuidad impulsada por flujos: la mayor entrada diaria desde May 29 y el aumento de los activos netos totales señalan que las instituciones están acumulando, no solo negociando. Los ETFs también reducen la fricción para compradores incrementales, lo que puede mantener la demanda estable durante las correcciones.
Riesgo clave: Interrupción regulatoria o de flujos del emisor (o un día de salidas repentinas) que revierta la tendencia de entradas y presione el precio a la baja pese a la tendencia alcista general del mercado cripto.
- Los ETFs centrados en HYPE registraron una entrada de $17.19 million el lunes.
- HYPE cotiza por encima de $70 tras ganar un 12% en las últimas 24 horas.
- HYPE podría establecer un nuevo máximo histórico (ATH) a corto plazo si persiste el impulso alcista.
Hyperliquid HYPE continuó su impulso alcista el martes, subiendo por sexto día consecutivo y superando el nivel de $70 a medida que el sentimiento alcista se fortalece en todo el mercado.
El último repunte está siendo respaldado por entradas recurrentes en productos cotizados centrados en HYPE, lo que sugiere una demanda institucional sostenida por el token de la “everything exchange”.
ETF inflows rebound as institutional interest returns
Tras una breve corrección a principios de mes, HYPE ha visto una participación institucional renovada.
On Monday, HYPE-focused ETFs recorded a inflow 17,2 millones USD (aprox. 15 millones €), the largest daily intake since May 29.
This pushed total net assets in HYPE ETFs up to 209,3 millones USD (aprox. 182,5 millones €), compared with 173,1 millones USD (aprox. 151 millones €) at the end of last week.
Three issuers now offer regulated brokerage exposure to HYPE: THYP from 21Shares, BHYP from Bitwise, and HYPG from Grayscale.
Cumulative volume across the three has approached 900 millones USD (aprox. 785,1 millones €) since launch, with net inflows reaching 153 millones USD (aprox. 133,5 millones €).
The rebound in inflows points to improving confidence among institutional investors following the recent pullback.
Beyond ETF flows, Hyperliquid’s fundamentals continue to strengthen.
The platform recently recorded 3 mil millones USD (aprox. 2,6 mil millones €) in Real-World Asset (RWA) open interest on its HIP-3 framework, marking another milestone in its expansion into traditional financial market exposure.
HIP-3 has reportedly set new records in open interest every month since its launch in October 2025, reinforcing its position as a key driver of institutional engagement on the platform.
Hyperliquid technical outlook: Bulls target break above $75
Similar to the other leading cryptocurrencies, the HYPE/USD 4-hour chart is bullish and efficient.
HYPE is currently trading near $75, maintaining a strong bullish structure as price remains well above its key moving averages.
The 50-day, 100-day, and 200-day exponential moving averages (EMAs) are clustered between approximately $42.80 and $55.70, indicating that the broader trend remains firmly upward.
The recent V-shaped rebound from around $53, near the 50-day EMA, suggests that dips continue to attract buyers, reinforcing the medium-term uptrend.
Momentum indicators support the current bullish bias, though they are not yet overheated.
The Relative Strength Index (RSI) sits near 80, indicating that it is now entering overbought territory.
Meanwhile, the Moving Average Convergence Divergence (MACD) is approaching a bullish crossover, with narrowing negative histogram bars suggesting fading downside pressure.
If the bullish trend persists, immediate resistance is located at the June 1 all-time high of $75.76.
A clean breakout above this level could open the door toward a new all-time high between $83.63 and $94.83.
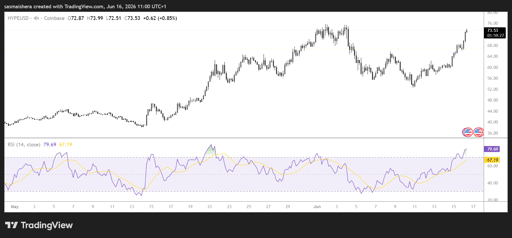
However, if the market undergoes a correction, initial support will be encountered near $63.17, followed by stronger structural support around the 50-day EMA at $55.69.
Overall, HYPE maintains a constructive technical and fundamental setup, with continued ETF inflows and rising open interest supporting the case for further upside, provided it can clear its record high resistance zone.

¿Por qué sube el precio de Injective?

Uniswap supera los $4: ¿está por estallar un breakout mayor de UNI?

PI sube un 10%: ¿está por fin formándose una ruptura alcista?

PENGU sufre tras debut del cómic: ¿por qué venden los traders?

XRP en riesgo tras aplazarse en el Senado la votación del CLARITY Act?
No se encontraron resultados
Cargando artículos...
Failed to load articles. Please try again.