
Ethereum stiger 18% etter $1 milliard short squeeze som driver kryptoutbrudd

AI-sentiment: 86/100 Bullish
Denne poengsummen genereres gjennom KI-drevet analyse av artikkelens innhold.

drevet av

Kjøp Ethereum (ETH) via spot eller iShares-lignende eksponering (f.eks. BlackRock’s ETHA). $1B short squeeze gir fortsatt momentum, og den makroøkonomiske medvinden (større Treasury-buyback-likviditet + lavere langsiktige yields) støtter risikoaktiva. Teknisk bekrefter et reelt utbrudd: ETH er over Keltner-øvre bånd og holder seg nær session VWAP, med OBV stigende og Supertrend bullish—så nedgang bør bli kjøpt mot $2,275–$2,300 og deretter $2,320–$2,350.
Nøkkelrisiko: En brå reversering i renter/risikosentiment som utløser en ny bølge med ETH-shorting og bryter under VWAP/Supertrend (omtrent ~$2,015–$2,200), som forvandler squeezet til et kraftig salg.
Selg ETH-volatilitet ved å bruke en stram, risikoavgrenset struktur (f.eks. selg en at-the-money straddle eller selg near-the-money call/put-spreads). Den nyhetsdrevne bevegelsen tvang allerede fram massive short-likvidasjoner ($1.02B shorts), og prisen stabiliserer seg nær VWAP—dette presser vanligvis implisitt volatilitet etter den innledende spiken. Med oppside-likviditetspooler over ($2,275–$2,300) men uten garanti for en rett linje, ønsker du premien skal forfalle mens markedet fordøyer utbruddet.
Nøkkelrisiko: ETH bryter og akselererer gjennom $2,300 inn i $2,400–$2,450, noe som øker volatiliteten og blåser gjennom short-vol strike-området.
- Ethereum has rallied nearly 18% over the past 24 hours.
- More than $1 billion in ETH short positions were liquidated.
- ETH could target $2,320 to $2,350 above $2,300.
Ethereum has rallied 17.7% over the past 24 hours to $2,249.80, with more than $1 billion in ETH short positions liquidated as falling US Treasury yields and fresh regulatory developments drove traders back into crypto.
CoinGecko data showed ETH climbing from below $1,950 on Aug. 19 to an intraday peak near $2,300 before settling close to $2,250 on Aug. 20, leaving the token up 19.3% over the past seven days.
The rally followed a US Treasury announcement on Aug. 19 that it would at least double the size of liquidity-support buybacks for longer-dated government debt.
The maximum purchase size for 10-to-20-year and 20-to-30-year nominal coupon securities will increase from $2 billion to at least $4 billion per operation between Sept. 9 and Nov. 4.
Reuters reported that long-dated US government bond yields fell by as much as 10 basis points after the announcement, while cryptocurrencies and gold moved higher.
The 30-year Treasury yield had climbed to nearly 5.34% before the intervention, its highest level in almost two decades.
Lower long-term yields reduced some of the pressure that had been weighing on risk assets, while the Treasury's decision also added liquidity support to the government bond market.
ETH's price move accelerated as leveraged traders positioned for further losses were forced out.
CoinGlass data showed $1.13 billion in ETH liquidations over the past 24 hours, of which $1.02 billion came from short positions. Long liquidations stood at just $104.16 million during the same period.
Over 12 hours, another $560.52 million in shorts were liquidated against $56.27 million in longs, showing how heavily the derivatives unwind was concentrated among bearish positions.
With ETH breaking through $2,000 and then $2,100, forced purchases from short liquidations added to the buying already pushing the token higher.
Regulatory news from Washington had also started building before the breakout.
The US Securities and Exchange Commission proposed Regulation Crypto Assets on Aug. 18, introducing a specific offering framework for certain investment contracts involving crypto assets.
SEC Commissioner Mark Uyeda said the proposal includes a startup exemption covering up to $5 million over four years and a separate fundraising exemption allowing as much as $75 million during a 12-month period.
The SEC proposal also includes a conditional safe harbour under which a crypto asset would be deemed not to be subject to an investment contract for securities-law purposes if the required conditions are met.
One day later, US President Donald Trump hosted crypto and financial industry executives at the White House and urged Congress to pass a version of the Digital Asset Market Clarity Act.
Executives from companies including Coinbase, Robinhood and Kraken attended alongside federal regulators, while CoinDesk reported that the gathering preceded a Commodity Futures Trading Commission Innovation Advisory Committee meeting.
Institutional flows had also turned positive before ETH broke higher.
Data from SoSoValue showed US spot Ethereum exchange-traded funds recorded $71.47 million in net inflows on Aug. 18, led by BlackRock's ETHA with $64.68 million, or roughly 90% of the daily total.
ETH-prisanalyse
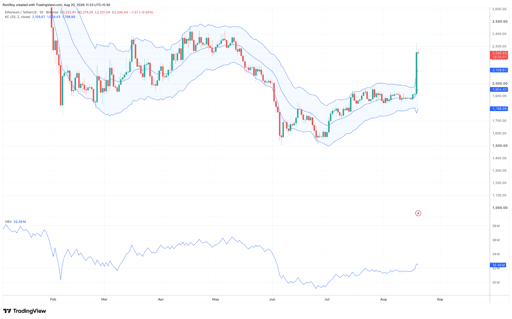
The daily Binance ETH/USDT chart shows ETH breaking sharply above its Keltner Channel after spending much of August between roughly $1,850 and $1,950.
ETH/USDT 1-day price chart. Source: TradingView.
The Keltner Channel's upper boundary currently sits at $2,109.87, while the middle and lower bands stand at $1,954.43 and $1,798.99, respectively.
ETH trading near $2,245 places the price well above the upper band, confirming strong momentum on the breakout while also showing that the daily move has become stretched relative to its recent volatility range.
Volume behaviour has supported the breakout so far. ETH’s On Balance Volume reading rose sharply to 32.48 million as ETH cleared $2,000, showing that the price jump was accompanied by increased net buying volume rather than occurring while OBV moved lower.
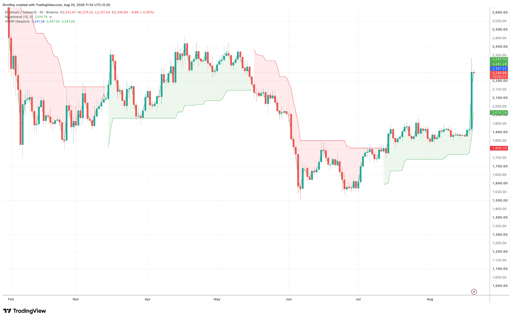
The Supertrend has also turned bullish, with the indicator flipping below price and currently sitting at $2,014.74, making the $2,000–$2,015 area an important level for maintaining the daily bullish structure.
ETH/USDT 1-day price chart. Source: TradingView.
At the same time, ETH is trading almost directly on its session VWAP at $2,247.24 after reaching a daily high of $2,274.25.
Trading near VWAP after the initial spike means buyers and sellers are currently transacting close to the session's volume-weighted average rather than price immediately falling back towards the breakout zone.
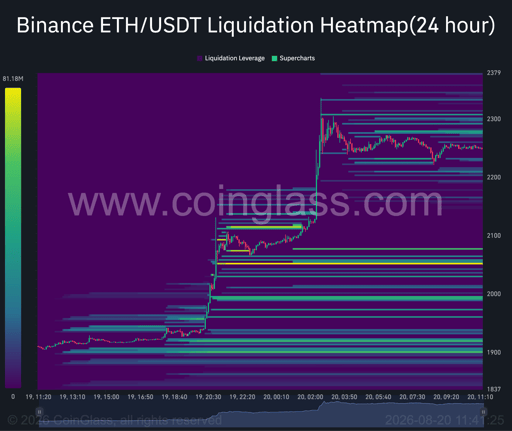
CoinGlass's 24-hour Binance ETH/USDT liquidation heatmap places the closest significant pools of remaining liquidity above price between roughly $2,275 and $2,300. See below.
ETH/USDT 24-hour liquidation heatmap. Source: Coinglass.
Further liquidation concentrations can be seen from roughly $2,320 to $2,350.
A sustained move through $2,300 could open the way towards the next potential target zone at $2,320–$2,350.
Above it, another resistance area sits near $2,400–$2,450, where ETH faced repeated selling pressure during April and May.
On the downside, liquidity remains concentrated near $2,200, making it the first level to watch if ETH loses VWAP.
Stronger technical support sits near $2,110 and $2,015, while a break below the Supertrend level could put the Keltner midline near $1,954 back in focus.

Risikerer Ethereum-prisen å falle under $2,400 etter at olje passerer $105?

Cardano faller 3 % da futures-volumet synker til $652M

Bitcoin varsler nær $78 000 — overser markedet det?

Ethereum faller under $2,500: forbereder denne korreksjonen neste ETH-oppgang?

Solana-prisen risikerer å falle under $100 etter økende negativt momentum
Ingen resultater funnet
Laster artikler...
Failed to load articles. Please try again.