SPX6900 rośnie o 15% po notowaniach na Upbit i Bithumb

Sentyment AI: 78/100 Byczy
Ten wynik jest generowany na podstawie analizy treści artykułu napędzanej sztuczną inteligencją.
Wspierane przez
Buy SPX6900. Upbit + Bithumb KRW listings put the token in front of Korea’s biggest retail flow, and the breakout above the $0.33–$0.35 high-volume zone shows real acceptance at higher prices. On-chain leverage longs and Wintermute accumulation confirm demand isn’t just hype. Target $0.45–$0.46 (200-day EMA area); exit if it loses the $0.39–$0.40 breakout area.
Kluczowe ryzyko: Listings fail to sustain volume and SPX quickly falls back below the $0.33–$0.35 breakout zone, turning the move into a short-lived pump.
Buy SPX perpetual exposure on HyperLiquid (long). The article shows fresh, large 10x leveraged longs and rising momentum; that combination usually pulls in more trend-following and forces additional longs via liquidations on dips. This is a momentum trade riding the second wave after the exchange access headline.
Kluczowe ryzyko: A sharp reversal triggers liquidation cascades against longs, driving SPX down through support fast (especially below $0.39 and then $0.35).
- SPX6900 rose 15% after Upbit and Bithumb listings.
- SPX has broken above a major volume support zone near $0.35.
- The 200-day EMA near $0.46 is the next major technical hurdle.
SPX6900 has climbed more than 15% in the past 24 hours after securing listings on South Korea’s two largest cryptocurrency exchanges, while whale activity and fresh accumulation by a major market maker have added to buying interest.
Wiodące koreańskie giełdy Upbit i Bithumb ogłosiły 16 czerwca wsparcie dla SPX6900 SPX, udostępniając token memowy lokalnym traderom poprzez pary handlowe w KRW.
Upbit launched trading across KRW, BTC, and USDT markets at 14:00 KST, while Bithumb scheduled its SPX/KRW market to begin three hours later.
Notowania wystawiły SPX na jeden z najbardziej aktywnych światowych rynków detalicznych kryptowalut.
According to data from CoinGecko, the token was trading near $0.39 after reaching an intraday high of $0.40, with weekly gains exceeding 25%.
Dodatkowe zainteresowanie zakupami pojawiło się wskutek aktywności on-chain.
According to OnchainLens, a newly created wallet deposited 1,7 mln USD (ok. 6,4 mln zł) in USDC and opened a 49,687 SPX long position with 10x leverage on HyperLiquid. At the time of reporting, the position was valued at roughly 8,5 mln USD (ok. 31,8 mln zł).
Jednocześnie raporty on-chain wskazywały, że twórca rynku Wintermute zwiększył swoje pozycje w SPX.
Połączenie notowań na giełdach, pozycji wielorybów i aktywności akumulacyjnej przyciągnęło odnowioną uwagę do tokena, który oparty jest na parodii S&P 500 i czerpie głównie atrakcyjność z kultury internetowej oraz brandingu napędzanego memami.
Analiza ceny SPX6900
Recent chart data shows SPX6900 breaking out of a consolidation range that had held for several weeks.
On the four-hour chart, the token moved above a major volume cluster between $0.33 and $0.35, an area identified by the Volume Profile Visible Range indicator as one of the most actively traded zones during the recent downtrend.
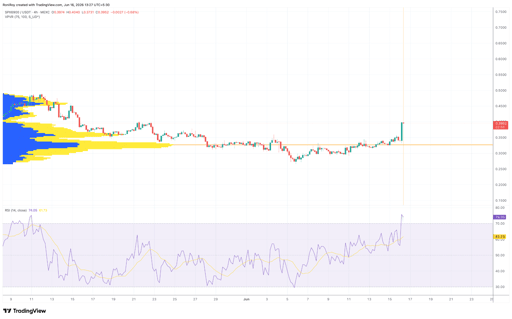
SPX6900/USDT 4-hour price chart. Source: TradingView.
Handel powyżej tej strefy o dużym wolumenie sugeruje, że kupujący dotychczas zaakceptowali wyższe ceny po notowaniach na giełdach.
The same volume profile shows relatively limited trading activity between $0.39 and $0.45, which could allow for larger price swings if momentum continues or reverses.
Momentum indicators also point to strong short-term demand. The four-hour Relative Strength Index has climbed to about 74, placing SPX in overbought territory.
While elevated RSI readings can precede pullbacks, the indicator has continued to rise alongside price, showing no clear bearish divergence at the time of writing.
On the daily chart, however, the outlook is a lot different.
After spending months below key moving averages, SPX6900 has reclaimed its 20-day, 50-day, and 100-day exponential moving averages.
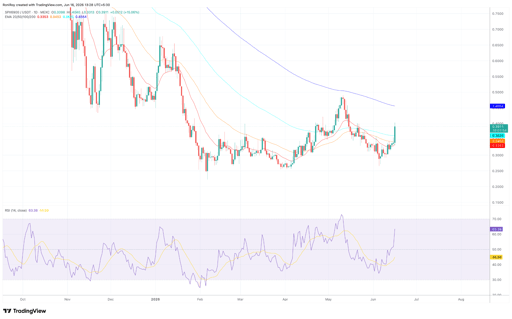
SPX6900/USDT 1-day price chart. Source: TradingView.
Those levels currently sit near $0.34 to $0.36 and have turned into nearby support areas following the latest rally.
Daily RSI has risen to around 63, a level that remains below traditional overbought territory and suggests momentum is still improving on a higher timeframe.
Price, however, remains below the 200-day exponential moving average near $0.46.
For now, that long-term moving average represents the next major resistance level.
A move toward the $0.45 to $0.46 region could come into focus if buying pressure linked to the Korean listings and recent whale activity persists, while a return toward the $0.33 to $0.35 volume cluster would likely test whether the latest breakout can hold.

Prognoza ceny Hedera (HBAR): atak na Bonzo i adopcja przez Lloyds

Cena BONK rośnie po ulżeniu CPI: czy byki przełamią barierę $0.0000040?

Czy Chainlink zmierza do 10 USD po najnowszym rajdzie?

Cena CRV celuje w 17% wybicie, gdy wieloryby ograniczają podaż na giełdach

ETH rośnie 5% po schłodzeniu inflacji — czy byki przebiją barierę $1,909?
Nie znaleziono wyników
Ładowanie artykułów...
Failed to load articles. Please try again.