Prognoza kursu ORCA: układ wskazuje na możliwe kolejne wybicie

Sentyment AI: 68/100 Byczy
Ten wynik jest generowany na podstawie analizy treści artykułu napędzanej sztuczną inteligencją.
Wspierane przez
Kupuj ORCA (spot) w rejonie $1.62–$1.65 tylko jeśli odzyska i utrzyma tę strefę popytu, a następnie dokładaj po dziennym zamknięciu powyżej $1.75. Artykuł wskazuje na serię wyższych dołków od 25 kwietnia oraz na „nietestowany” obszar płynności, który często jest retestowany, a następnie przebijany w górę. Cel $2.10 (ok. +22% od strefy popytu).
Kluczowe ryzyko: ORCA nie utrzyma $1.62–$1.65 i przełamie się poniżej $1.50–$1.55, co przekształci bazę w głębszą wyprzedaż.
Sprzedaj/zajmij krótką pozycję na BTC (perpetuals BTC lub zabezpieczenie spot BTC), ponieważ odpływy z ETF-ów ($263M) i niepewność związana z Fed wywierają presję na aktywa ryzykowne; ORCA jest opisywana jako wysoce wrażliwa na te wahania. Ten handel przyniesie zysk, jeśli słabość BTC pociągnie altcoiny i nie powiedzie się próba wybicia ORCA.
Kluczowe ryzyko: Odwrotność odpływów z ETF-ów i rajd BTC, które podniosą altcoiny i wywołają squeeze shortów.
- Current pullback follows 108% weekly surge with heavy profit-taking volume.
- Key demand zone sits at $1.62–$1.65 where structure may reset upward.
- Holding support keeps $2.10 target valid, while a breakdown risks $1.50–$1.55.
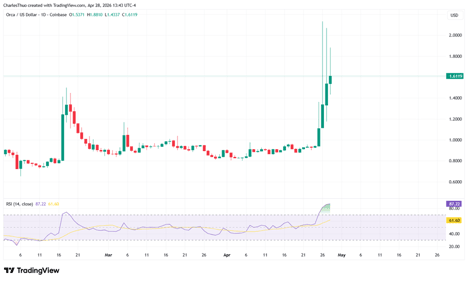
ORCA is trading near $1.61 after a volatile session that saw the token pull back from recent highs and consolidate within a tight short-term range.
Despite today’s drop of 16.2% in the last 24 hours, the broader price structure still shows signs of sustained upward momentum building from April 25.
Recent price action and profit-taking pressure
The latest move in ORCA comes after a rapid expansion phase that saw the token rise by roughly 108% over a one-week period before reaching highs near $1.90.
This sharp upward move was followed by a correction phase, with trading activity showing increased volume of over $380 million in a single day, signalling active distribution after the rally.
Market flow data indicates that part of the earlier rally was driven by strong retail demand from Korean exchanges, particularly Upbit, where buying activity accelerated during the breakout phase.
Once the price extended rapidly, short-term holders began locking in gains, contributing to the current pullback.
At the same time, broader crypto sentiment has been cautious.
The leading cryptocurrency, Bitcoin (BTC), has experienced weakness as US spot Bitcoin ETFs recorded $263 million in outflows, breaking a nine-day inflow streak.
This shift in sentiment ahead of the Federal Reserve policy decision has added pressure on altcoins, including ORCA, which tends to move with higher sensitivity to risk-on and risk-off shifts in the market.
A breakout pattern is forming
Since the breakout on April 25, ORCA has been forming a series of higher lows, even as volatility has increased.
This is a notable change in structure after a prolonged downtrend that followed its decline toward all-time lows earlier in the year.
The most important technical area in the current structure is the demand zone between $1.620 and $1.650.
This zone acted as the launch point for the most recent upward impulse, where ORCA's price moved from approximately $1.450 to near $1.900 without a proper retest.
In technical terms, this creates an unmitigated area of interest where liquidity remains untested.
Currently, ORCA is trading just below this region at around $1.61–$1.65, depending on intraday movement.
The current market structure suggests that if the price breaks above the $1.620–$1.650 area and holds above $1.75, it could serve as a continuation base for the next leg higher.
This setup projects a potential move toward $2.10, which represents an extension of roughly 22% from the demand zone.
However, the RSI on the daily chart is still in the overbought region, meaning the current correction could go on for some time before the next breakout.
And as the price pulls back, market projections show that traders should keep their eyes on the $1.50–$1.55 zone, which is the next major support area to monitor.

Cena HYPE pozostaje poniżej $60: czy odbicie już straciło impet?

BitMEX zamyka działalność z powodu słabego rynku aktywów cyfrowych

Cena Pi Network utrzymuje się na poziomie $0.09, gdy Open Interest spada z niedawnego szczytu

Cena Bitcoina spada poniżej $65,800: czy nadchodzi głębsza korekta?

Cena Ethena rośnie o 5% — ekspansja USDe napędza nadzieje na wybicie
Nie znaleziono wyników
Ładowanie artykułów...
Failed to load articles. Please try again.