Bitcoin bulls face $64,000 test as ETF outflows weaken sentiment

AI Sentiment: 22/100 Bearish
This score is generated through AI-driven analysis of the article's content.
powered by
Buy Bitcoin only on a clean 4-hour close above $64,004, targeting a move to the 50-day EMA (~$68,596) and then $71,747 (100-day EMA). Rationale: ETF outflows are pressuring sentiment, but RSI ~37 and improving momentum suggest selling pressure is easing; a reclaim of the key resistance would force shorts to cover and pull buyers back in.
Key Risk: ETF outflows accelerate again and BTC fails back below $64,000, turning the “stabilizing” setup into a fresh leg down.
Sell/short Bitcoin if it rejects $64,000–$68,600 (50-day EMA zone), targeting a retest of the ~$60,000 trendline support. Rationale: price is still below the 50/100/200-day EMAs and the article flags “bearish until reclaimed”; ETF outflows keep a ceiling overhead, so rallies are likely to be sold until BTC proves otherwise.
Key Risk: BTC breaks and holds above the 50-day EMA cluster (~$68,600), invalidating the “rally to sell” pattern.
- BTC remains bearish as it trades below the its 50-day EMA.
- Spot Bitcoin ETFs recorded an outflow of $355 million over last four days.
- Bitcoin needs to defend $60,000 psychological level to enable the bulls to push higher.
Bitcoin BTC remained under pressure on Wednesday, trading below the $63,000 mark after posting modest losses in the previous session.
The world's largest cryptocurrency continues to face strong technical resistance, suggesting the ongoing correction could extend in the near term.
The broader weakness across the crypto market is also weighing on sentiment, with Ethereum (ETH) trading below $1,700 and Ripple (XRP) showing signs of fading momentum.
BTC remains trapped below the moving averages
At the time of writing, Bitcoin is changing hands near $62,600 and remains firmly below its major trend indicators.
The cryptocurrency continues to trade beneath its 50-day Exponential Moving Average (EMA) at approximately $68,596, 100-day EMA near $71,747, and 200-day EMA around $77,384.
The bearish performance comes as institutions continue to pull funds away from Bitcoin ETFs.
According to CoinGlass’s ETF page, spot Bitcoin ETFs recorded an outflow of USD 113.8 million (approx. $165.8 million) on Tuesday.
The ETFs recorded a total of USD 355 million (approx. $517.3 million) in outflow over the past four days, indicating massive capital extraction.
Bitcoin price forecast: $64,000 resistance level remains in play
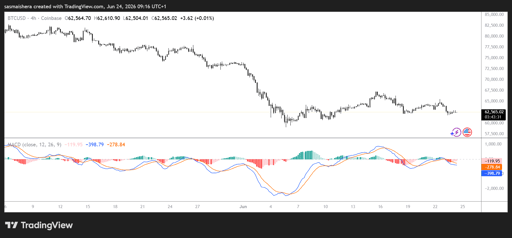
The BTC/USD 4-hour chart remains bearish as Bitcoin has lost 4% of its value since the start of the week.
While the broader trend remains bearish, momentum indicators suggest selling pressure may be gradually easing.
The Relative Strength Index (RSI) is hovering near 37, placing Bitcoin in mildly oversold territory.
This indicates that downside momentum has weakened compared to previous sessions, though the indicator remains below the neutral 50 level.
Meanwhile, the Moving Average Convergence Divergence (MACD) remains in positive territory.
However, rather than signaling a strong bullish reversal, the indicator currently points to fading downside momentum and potential consolidation.
Together, these indicators suggest the market may be stabilizing, but there is not yet enough evidence to confirm a trend reversal.
For Bitcoin to improve its short-term outlook, bulls must first overcome a series of resistance levels.
The initial resistance sits near the horizontal resistance zone around $64,004. A break above this level could open the door for a move toward the 50-day EMA at approximately $68,596.
Beyond that, the 100-day EMA near $71,747 represents another significant hurdle.
A sustained breakout above this cluster of moving averages would be required to meaningfully reduce bearish pressure and shift market sentiment.
On the downside, traders are closely monitoring a rising trendline support originating near the $60,000 region.
This trendline has provided support during previous pullbacks and remains an important level for maintaining the current market structure.
A daily close below this support zone could trigger additional selling pressure and expose Bitcoin to lower psychological price levels, potentially accelerating the ongoing correction.
Despite signs that downside momentum may be slowing, Bitcoin's technical outlook remains cautious as long as the asset trades below its major moving averages.
The combination of strong overhead resistance, weakening market sentiment, and an unresolved corrective structure suggests bears continue to hold the advantage.
For now, Bitcoin must reclaim the $64,000 level and break through the key EMA resistance cluster before a more convincing recovery can take shape.
Until then, the risk of further downside remains in place.

Injective price jumps 5%: can the Washington summit send INJ to $6?

CASHCAT explodes 2,300% as whale buying fuels fresh meme coin frenzy

Shiba Inu price slips again: is SHIB heading back to its yearly low?

Can LAB price recover after crashing 97%?

Will BitMine’s latest ETH purchase push Ethereum above $1,800?
No results found
Loading articles...
Failed to load articles. Please try again.