HYPE rebounds from $59, but weak leverage keeps bulls on a leash

AI Sentiment: 42/100 Bearish
This score is generated through AI-driven analysis of the article's content.
powered by
Buy HYPE (spot) around $59–$62. Setup: leveraged longs were liquidated and spot CVD has started to recover; strong buy orders absorbed selling at $59–$59.80. Technicals: daily uptrend intact, reclaiming/holding the 20-day EMA near ~$64 keeps the path open toward the prior $75–$76 resistance. Thesis killer: HYPE loses the $59 support and spot demand doesn’t return, dragging price into the $50–$54 support zone.
Key Risk: Spot buyers fail to step back in and HYPE breaks below $59, accelerating to $50–$54.
Sell HYPE perpetuals (short) if price rejects $64–$66. Setup: open interest is falling and derivatives CVD remains deeply negative—traders are de-risking, not adding longs. With momentum cooled (RSI ~50, MACD weakening), rallies into the 20-day EMA area are likely to be sold. Thesis killer: spot accumulation turns into real derivatives re-leverage (open interest stops falling and derivatives CVD improves), pushing HYPE through $66 toward $75–$76.
Key Risk: Derivatives positioning flips—open interest rises and CVD improves—turning the rejection into a breakout.
- HYPE has rebounded after recent dip, but demand remains weak.
- Derivatives traders have continued to cut exposure to the altcoin.
- The $50 to $54 zone currently stands as the next key support.
HYPE has rebounded to around $63.5 after a June 24 selloff dragged the token to an intraday low of $59.18, leaving it down about 11% over the past seven days despite a 2% recovery in the last 24 hours.
A sharp risk-off wave swept across financial markets, amplified by institutional de-risking ahead of the highly anticipated May PCE inflation data and a steep selloff in semiconductor stocks.
This macro pressure accelerated a multi-day slide that had already pulled Bitcoin below $65,000, ultimately forcing it under the psychological $60,000 threshold on Wednesday, June 24.
This was accompanied by a wave of long liquidations across the crypto market.
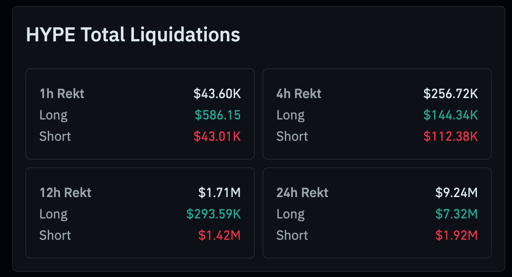
Source: Coinglass.
As leveraged positions unwound, HYPE fell nearly 9% during the session before buyers stepped back in around the $59 level.
The correction also followed an extended rally that carried HYPE to an all-time high near $76.90 on June 16. The token has since fallen by over 16%.
Data from CryptoQuant and Santiment showed both spot and futures markets had become overheated after the advance, while social activity had started to cool.
Nevertheless, strong buy orders managed to absorb selling around the $59 to $59.80 range, with Hyperliquid's tokenomics continuing to support demand through its repurchase mechanism that directs 97% to 99% of platform trading fees toward HYPE buybacks.
Spot demand improves, but derivatives traders remain cautious
Fresh on-chain data suggests some of the selling pressure has started to ease, although conviction among traders remains limited.
According to data from Velo.xyz, HYPE’s aggregated spot cumulative volume delta, or CVD, has recovered from recent lows after heavy selling earlier this month.
The indicator, which tracks net buying and selling activity in spot markets, remains negative at nearly $95 million, but the imbalance has narrowed from the roughly USD 110 million (approx. $160.3 million) in selling recorded during HYPE's drop from $76 in early June.
The improvement suggests buyers have become more willing to absorb supply around current prices, but the token is yet to enter a strong accumulation phase.
Derivatives positioning around the token has simultaneously continued to weaken.
HYPE’s open interest has declined, while derivatives CVD has slipped to around negative USD 389 million (approx. $566.9 million)from roughly negative USD 400 million (approx. $582.9 million) at the start of June.
The means traders are reducing exposure instead of opening fresh leveraged positions, which is limiting the strength of the current recovery.
Technical indicators keep $50 to $54 in focus
As of publication time, HYPE remains in an established uptrend on the daily chart, despite the recent pullback.
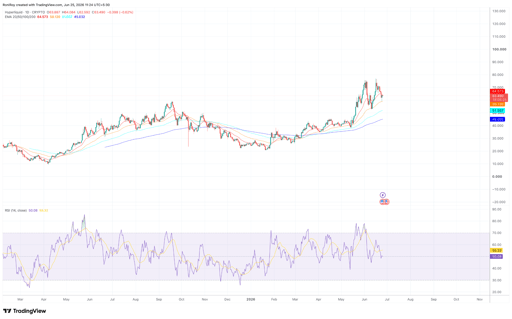
HYPE/USD 1-day price chart. Source: TradingView.
However, momentum has cooled considerably after its recent rally to an all-time high earlier this week.
The token is testing its 20-day exponential moving average near $64 after failing to reclaim the $75 to $76 resistance area.
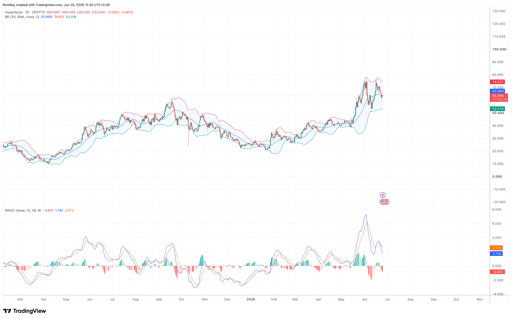
HYPE/USD 1-day price chart. Source: TradingView.
Below current prices, the 50-day EMA around $59 has once again acted as support, while the 100-day EMA near $52 aligns closely with the lower Bollinger Band around $53.3.
Together, the indicators reinforce the $50 to $54 region as the next major support zone if sellers regain control.
Meanwhile, HYPE’s relative strength index has eased to around the neutral 50 level after previously reaching overbought territory, a setup similar to the consolidation HYPE experienced after reaching a local high in May 2025.
At the same time, the MACD remains above the zero line, showing the longer-term trend is still positive, although a bearish crossover and a negative histogram indicate bullish momentum has weakened in the short term.
For now, the recovery above $62 has prevented a more severe technical breakdown.
Sustained buying in the spot market and renewed participation from derivatives traders would strengthen the case for another attempt at higher levels.
Failure to attract fresh demand, however, could leave HYPE vulnerable to another test of the $59 support area, with the $50 to $54 zone standing out as the next important line of defense.

MemeCore sheds nearly $3 billion in value as M token collapses 76%

Bitcoin rebounds from $59K, but bears still control the next move

ONDO price outlook: Can $0.30 hold as RWA momentum builds?

KuCoin Pay expands crypto payments Across Bangladesh, Mexico, Zambia

Can LINK price reclaim $8 as Chainlink targets real-time FX settlement?
No results found
Loading articles...
Failed to load articles. Please try again.