
HYPE price remains below $60: has the recovery already lost its edge?

AI Sentiment: 18/100 Bearish
This score is generated through AI-driven analysis of the article's content.

powered by

Sell HYPE (spot or perpetuals) while it’s below $60 and under the 50-day EMA ($62.52). The article flags weak demand (no ETF inflows this week, retail slowing), bearish market structure (broken ascending trendline now resistance ~ $60.72), and momentum still negative (RSI ~40, MACD below zero). Target $54.19 first, then $50.77 (200-day EMA) if selling accelerates. Key risk: HYPE reclaims and holds above $62.52/$60.72, flipping trend and forcing shorts to cover.
Key Risk: HYPE breaks back above $62.52 and holds, reversing the bearish structure and triggering a short squeeze.
Sell exposure to Hyperliquid via HYPE-linked ETF positions (or avoid new buys) because the thesis is “no inflows = no bid.” The article shows zero ETF inflow days this week after a Tuesday outflow, meaning institutions are stepping away. Pair this with staying short HYPE until ETF flows turn positive; if flows remain flat/negative, rallies should fail at resistance ($60.72–$62.52). Key risk: ETF inflows resume strongly (multiple consecutive inflow days), restoring institutional demand and undermining the “no bid” setup.
Key Risk: ETF inflows turn positive and persist, bringing institutional buyers back and supporting HYPE through resistance.
- HYPE is trading below the 50-day EMA, signaling growing bearish momentum.
- Technical indicators, including the RSI and MACD, continue to favor sellers.
- Bulls must reclaim $60.72 and the 50-day EMA to improve short-term outlook.
Hyperliquid’s HYPE is up by less than 1% in the last 24 hours and remains below the key $60 support.
The retail and institutional demand remains muted, with the bears targeting the $54 support level in the near term.
ETF inflows stay muted, retail demand declines
HYPE has lost 10% of its value in the last seven days, making it the worst performer among the top 10 cryptocurrencies during that period.
The bearish performance comes amid a decline in retail and institutional demand.
According to CoinGlass’s ETF page, Hyperliquid Exchange-Traded Funds (ETF) recorded no inflow on Wednesday. This comes after the funds saw an outflow of $0.7 million on Tuesday.
So far this week, the ETFs have yet to record a single day of inflow, indicating that institutions are decreasing their exposure to Hyperliquid.
Furthermore, retail demand has also slowed down in recent days.
Data obtained from CoinGlass shows that HYPE’s futures Open Interest (OI) is down 0.5% in the last 24 hours and now reads USD 2.5 billion (approx. $3.7 billion).
The long-to-short ratio over the last 24 hours reads 0.99, indicating that the bulls are paying the shorts (a bearish outlook).
However, the funding rate remains positive at 0.0039%, suggesting that buyers are still present in the market.
Hyperliquid breaks key support
The HYPE/USD 4-hour chart remains bearish and efficient as Hyperliquid remains below the $60.00 level after breaking a critical ascending support trendline.
The move has strengthened the bearish technical outlook, suggesting sellers remain firmly in control of the market.
Although the token continues to trade above its long-term 200-day Exponential Moving Average (EMA), recent price action indicates that bullish momentum has weakened considerably.
HYPE is currently trading below its 50-day EMA at $62.52, a level that had previously provided support during the recent uptrend.
The break below this ascending trendline, which has now turned into resistance around $60.72, signals a shift in market structure as buyers struggle to regain control.
Earlier attempts to recover were also rejected near the descending resistance trendline around $69.67, reinforcing the broader bearish outlook.
With multiple resistance levels capping upside momentum, the path of least resistance appears to remain to the downside.
If the bearish trend persists, the sellers will likely push HYPE’s price towards the next significant support at $54.19.
If selling pressure persists, HYPE could continue declining toward this area before attracting renewed buying interest.
Despite the recent weakness, the token remains above its 200-day EMA at $50.77, which may serve as an important longer-term support level if the correction deepens.
Momentum indicators continue to point toward further downside.
The Relative Strength Index (RSI) is currently around 40, remaining below the neutral 50 mark and indicating that bullish momentum has faded.
Meanwhile, the Moving Average Convergence Divergence (MACD) and its signal line remain below the zero line, confirming that bearish momentum continues to dominate.
Unless these indicators begin to recover, traders may remain cautious about the likelihood of a sustained rebound.
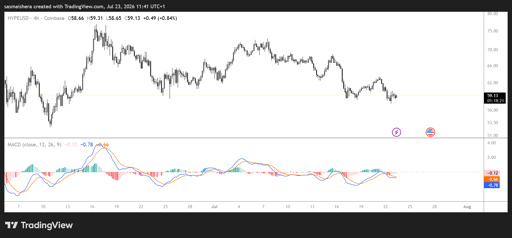
For bullish momentum to return, HYPE must overcome several technical barriers, including the former support trendline at $60.72 and the 50-day EMA at $62.52
A decisive move above these levels would weaken the current bearish outlook and could pave the way for a broader recovery.

Crypto exchange BitMEX announces closure amid weak digital asset markets

Pi Network price holds $0.09 as open interest sinks from recent peak

Bitcoin price slips below $65,800: is a deeper correction now coming?

Ethena price jumps 5% as USDe expansion fuels fresh breakout hopes

XRP price hits two-week high: can whale buying force a breakout?
No results found
Loading articles...
Failed to load articles. Please try again.
