
XRP is hanging near $1: why traders are bracing for another sharp drop

AI Sentiment: 18/100 Bearish
This score is generated through AI-driven analysis of the article's content.

powered by

Buy BTC and/or ETH versus XRP (long BTC-USD or ETH-USD, short XRP-USD). The article shows XRP-specific weakness (bearish derivatives positioning and failure to reclaim moving averages). If the broader crypto market stabilizes, XRP is the most likely laggard to keep bleeding while majors mean-revert less violently. This captures the “XRP underperforms” effect without needing a full market crash.
Key Risk: A broad risk-off move hits all crypto and XRP falls less than BTC/ETH, breaking the relative-performance edge.
Sell XRP (spot or perpetuals) while it’s below $1 and under all key EMAs (50-day ~$1.10, 100-day ~$1.18, 200-day ~$1.37). The derivatives setup is bearish: long-to-short ~0.94 (shorts dominate), funding is negative (-0.0009%), and open interest is rising—new money is leaning short. Expect a push through/under the $1 psychological support, with follow-through selling if there’s a decisive daily close below $1.00.
Key Risk: XRP reclaims the 50-day EMA (~$1.10) and squeezes shorts, flipping funding positive and forcing rapid upside covering.
- XRP trades near the psychological $1.00 support level as sellers dominate.
- The long-to-short ratio for XRP has declined to 0.88 amid retail decline.
- XRP must reclaim its 50-day EMA at $1.097 to ease the downside pressure.
Ripple XRP remains under pressure on Tuesday after recording modest declines during the previous session. XRP is drifting toward the psychologically important $1.00 level.
Weakening derivatives-market indicators are limiting the prospects of an immediate recovery for the cryptocurrency.
Declining long-to-short ratios, negative funding rates and rising open interest suggest that traders are increasingly positioning for further price declines.
XRP derivatives traders turn bearish
CoinGlass data indicates that derivatives traders have adopted a bearish stance toward XRP.
XRP’s long-to-short ratio stands at 0.94 on Tuesday, approaching its lowest level in more than a month.
A ratio below one indicates that short positions outnumber long positions, meaning more traders are betting that the assets will decline. The current readings suggest that the bearish sentiment is particularly strong.
The falling ratios also indicate that confidence in a near-term rebound is weakening as XRP struggle to recover from its recent losses.
The funding rate for XRP has also turned negative. XRP’s funding rate slipped below zero on Tuesday, reading -0.0009%.
Negative funding rates mean traders holding short positions are paying those with long positions to maintain their contracts. This usually occurs when bearish leveraged positions are more heavily concentrated than bullish ones.
Although deeply negative funding rates can occasionally create conditions for a short squeeze, the current readings primarily reflect a market leaning toward further downside.
Open interest across the XRP derivatives market has increased steadily since the beginning of August.
Outstanding XRP contracts have reached approximately 2.64 billion tokens, according to CoinGlass.
Open interest measures the total number of unsettled derivatives contracts. An increase generally indicates that fresh capital is entering the market.
When open interest rises alongside declining prices and negative funding rates, it can suggest that traders are opening new short positions.
This combination strengthens the bearish outlook for XRP and raises the risk of an extended correction.
However, the buildup in short exposure could also increase volatility. Any unexpected price recovery may force short sellers to close their positions, potentially accelerating an upward move.
XRP price approaches critical $1 support
XRP is trading near $1.005 on Tuesday, maintaining its bearish short-term structure.
The token remains below its major Exponential Moving Averages. The 50-day EMA sits at $1.097, while the 100-day and 200-day EMAs are positioned at $1.178 and $1.371, respectively.
With all three indicators above XRP’s current price, sellers continue to control the broader trend. The moving averages may also act as resistance during any attempted recovery.
The Relative Strength Index stands at 36, remaining below its neutral midpoint of 50. This reading reflects weak buying pressure, although XRP has not yet entered technically oversold territory.
The Moving Average Convergence Divergence indicator is also negative and remains below its zero line.
The setup reinforces the view that any near-term rebound may be corrective unless XRP can reclaim key resistance levels.
The psychological $1.00 level provides XRP’s immediate support. Buyers may attempt to defend this area and prevent a deeper decline.
A decisive daily close below $1.00 would strengthen the bearish outlook and could trigger additional selling pressure.
On the upside, XRP’s first significant resistance is located at the 50-day EMA near $1.097.
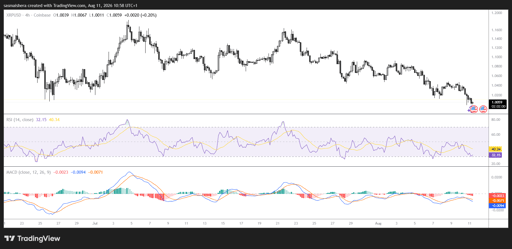
A sustained move above that level could allow the token to test its 100-day EMA at $1.178.
Further resistance sits at the horizontal barrier around $1.300, followed by the 200-day EMA at $1.371. XRP would need to reclaim these levels to weaken the broader bearish structure.
The more distant resistance at $1.900 represents a major ceiling. Until XRP moves back above its key moving averages, downside risks are likely to remain elevated.

Strategy (MSTR) stock gains after resuming Bitcoin purchases after 10 weeks

Ethereum price holds near $2,450 despite Fed pressure: Is $2,500 next?

Why is Bitcoin price down today?

PURR stock price forecast as Hyperliquid’s HYPE token hits a record high

Bitcoin ETFs keep buying, so why is BTC still stuck below $80K?
No results found
Loading articles...
Failed to load articles. Please try again.