
Ethereum whales are buying again, so why can’t ETH break above $2,000?

AI Sentiment: 52/100 Neutral
This score is generated through AI-driven analysis of the article's content.

powered by

Whales are accumulating (~+100k ETH) while ETH is still above the 20-day EMA ($1,884) and 50-day EMA ($1,865), with RSI ~47 and MACD below neutral—meaning downside momentum is limited. ETF flows are supportive (about $244.9m net inflows last week; only ~$8.9m outflows this week), which should help absorb exchange-driven selling and let ETH finally clear $1,922 then $1,961 toward $2,000.
Key Risk: ETF demand flips to sustained outflows, removing the main buyer that can absorb exchange selling and trapping ETH below $1,922.
Exchange reserves are rising (to ~15.13m ETH) and Coinbase premium remains negative (-0.081), signaling US retail/crypto-native demand is still weak. That combination often caps rallies inside the $1,800–$2,000 box. Sell/short ETH into the $1,961 resistance (and especially if it fails after tagging $1,922), targeting a move back toward $1,809 and possibly $1,701.
Key Risk: A clean breakout close above the 100-day EMA ($1,922) that holds, followed by acceptance above $1,961, turning the range into an upside trend.
- Ethereum’s Exchange Netflow and reserves point to mild selling pressure.
- Smaller investors sold a combined 160,000 ETH over past week as whales accumulate.
- ETH must clear the resistance at $1,922 and $1,961 to target a breakout.
Ethereum ETH remained confined within the $1,800–$2,000 range on Thursday as cautious crypto-native activity offset improving institutional demand.
Exchange data indicates a mild increase in potential selling pressure, while smaller ETH holders continue to reduce their positions.
However, accumulation by large whales and historically depressed profitability levels suggest that Ethereum could be approaching a market bottom.
From a technical perspective, ETH retains a mildly bullish short-term structure but must overcome resistance near $1,922 and $1,961 to escape its current consolidation range.
Ethereum exchange activity signals mild selling pressure
Ethereum’s Exchange Netflow is showing a modest dominance of inflows after its 14-day moving average turned positive.
Exchange Netflow measures the difference between the amount of ETH entering centralized exchanges and the amount leaving them.
A positive reading indicates that more coins are being deposited than withdrawn.
Investors often move crypto assets to exchanges when preparing to sell, meaning sustained positive netflows can increase the available supply and place downward pressure on prices.
The current increase remains relatively mild but supports the broader picture of caution among crypto-native investors.
Ethereum’s Exchange Reserves metric has also registered a slight increase. The total amount of ETH held on centralized exchanges remained mostly unchanged over the past week before rising to 15.13 million ETH during the last two days.
Growing reserves have historically been associated with higher selling pressure because they increase the supply of tokens readily available for trading. Falling reserves, by contrast, can indicate that investors are moving assets into private wallets for longer-term holding or staking.
Although the recent rise is small, it aligns with the positive Exchange Netflow and suggests sellers maintain a slight advantage.
Coinbase premium points to weak US crypto demand
The Coinbase Premium Index remains negative, falling to -0.081 over the past two days despite improving conditions in the US stock market.
The indicator compares the price of Ethereum on Coinbase with prices on other major exchanges. Positive values typically indicate stronger buying demand from US investors, while negative readings suggest weaker demand or greater selling pressure.
The continued discount shows that US-based crypto investors remain cautious, even as traditional markets improve.
Demand for US-listed spot Ethereum ETFs paints a more constructive picture. The investment products registered $244.9 million in net inflows last week, according to CoinGlass.
They have recorded only $8.9 million in net outflows so far this week, leaving most of the previous week’s demand intact.
The difference between ETF flows and exchange activity suggests that traditional and institutional investors may be more optimistic about Ethereum’s prospects than crypto-native market participants.
Continued ETF demand could help absorb selling pressure from retail investors and support ETH near the lower boundary of its current trading range.
Wallet distribution data highlights a growing divide between smaller ETH holders and large investors.
Wallets containing between 100 and 1,000 ETH and those holding between 1,000 and 10,000 ETH sold a combined 160,000 ETH over the past week. These cohorts have maintained a broader distribution pattern since late April.
Whales holding between 10,000 and 100,000 ETH moved in the opposite direction, accumulating approximately 100,000 ETH during the same period.
Whale accumulation can indicate that larger investors view current prices as attractive. However, the purchases have not fully offset the amount sold by the smaller wallet groups.
The opposing trends help explain why Ethereum remains trapped in consolidation rather than establishing a decisive directional move.
Ethereum price forecast: ETH struggles to escape EMA range
The ETH/USD 4-hour chart maintains a cautiously bullish near-term structure despite the current consolidatory phase. The price remains above the 20-day EMA at $1,884 and the 50-day EMA at $1,865.
The Relative Strength Index stands near 47, slightly below its neutral level of 50. The MACD also sits below the neutral level. Both indicators point to stable but limited downside momentum.
Immediate resistance lies at the 100-day EMA of $1,922. A close above this level could allow ETH to challenge the horizontal barrier near $1,961 and potentially reclaim the $2,000 psychological level.
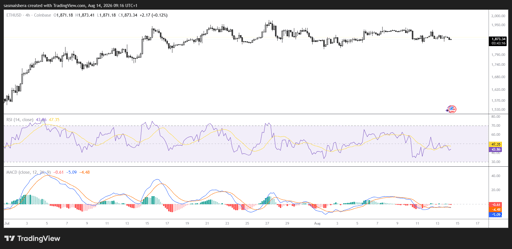
If bulls establish a breakout above the current range, the next major resistance levels sit at $2,172 and $2,431.
On the downside, the 20-day and 50-day EMAs provide initial support. A break below both averages could send ETH toward the stronger horizontal floor at $1,809.
Failure to hold $1,809 would weaken the near-term bullish outlook and expose deeper support levels at $1,701 and $1,507.

Why is Bitcoin price struggling around $80,000?

Zcash price breaks above $1,000 as institutional and privacy demand rise

Is XRP quietly building toward $1.90 as macro pressure eases and demand holds?

Bitcoin price defends $80,000 as bulls prepare another run at $82,000

Strategy, Coinbase stocks rally as Bitcoin reclaims $80,000
No results found
Loading articles...
Failed to load articles. Please try again.