
TLT ETF at risk despite soaring inflows as bond vigilantes fight back

AI Sentiment: 18/100 Bearish
This score is generated through AI-driven analysis of the article's content.

powered by

Sell TLT. The article flags “bond vigilantes” pushing 30-year yields to the highest since 2001 (auction yields up to ~5.22%), while TLT is breaking down technically (falling triangle breakdown, below 50-week MA, near 2023 lows). Even with heavy inflows, price is still falling—classic sign demand can’t offset rising yield pressure. Key level: $80 downside.
Key Risk: A sharp inflation drop or Fed pivot that drives 30-year yields down fast, flipping TLT back above ~$84 and invalidating the breakdown.
Sell TY (30Y Treasury futures). The core catalyst is higher long-end term premium from debt/auction pressure and persistent inflation (CPI still 3.5%). Futures give cleaner duration exposure than an ETF and should track the vigilante-driven repricing of the 30-year curve as auctions clear at higher yields.
Key Risk: A sustained risk-off shock (growth scare) that crushes yields despite debt concerns, forcing a rally in 30-year duration.
- The TLT ETF has dropped sharply in the past few years.
- US bond yields have soared as bond vigilantes fight back.
- US public debt is soaring and about to cross the $40 trillion mark.
The iShares 20+ Year Treasury Bond ETF TLT ETF continued its strong downward momentum and was trading at its lowest level since 2024. It has plunged by 54% from its highest point on record as US bond yields have soared and as the US public debt nears the $40 trillion milestone.
US bond yields soaring as public debt nears $40 trillion
There are signs that bond vigilantes are pushing the public debt towards the $40 trillion mark. This debt stands at over $39.065 trillion mark, up by over $3 trillion since President Donald Trump became president last year. If the trend continues, it means that the debt will cross the $40 trillion mark in the coming weeks.
Bond vigilantes have now pushed the US government to pay the highest borrowing costs to sell 30-year bonds since 2001. A $25 billion Treasury auction of 30-year bonds drew yields as high as 5.22%. Before that, the yield was 5.06% at the previous 30-year sale in July.
There are several reasons why bond yields are rising. First, there are concerns that the Japanese government will continue selling US Treasuries to boost the Japanese yen. The country has already sold bonds worth billions of dollars in the past few months, and the recent intervention has backfired.
US is overspending on key areas
Second, there are signs that the US government is overspending, with Trump’s vanity projects expected to cost billions of dollars. For example, according to the Washington Post, the renovations in the White House are expected to cost over $900 million. Also, he has requested over $87 billion for the war in Iran and is working to boost defense spending to over $1.5 trillion.
Most notably, the Supreme Court put the brakes on Trump’s “reciprocal tariffs”. While Trump has maintained his tariffs, they are less sweeping than those he had before the Supreme Court ruling. These tariffs would have helped the administration to reduce the debt growth.
Further, inflation has remained stubbornly high. A report released this week showed that the headline Consumer Price Index (CPI) slowed to 3.5%, remaining above the Federal Reserve’s target of 2%.
Still, despite these challenges, investors are piling into the TLT ETF. Data shows that the fund has had over $4.3 billion in inflows in the last month. Its net inflows in the last three months stand at $4.28 billion.
TLT ETF technicals suggest more pain ahead
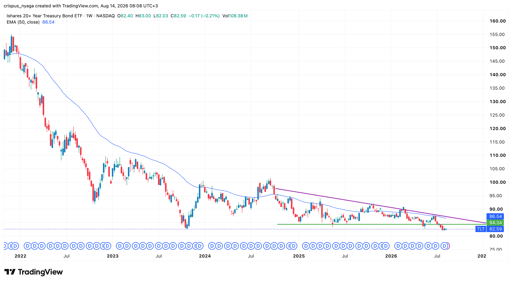
TLT ETF chart | Source: TradingView
The weekly chart shows that the TLT ETF has formed the risky falling triangle pattern, which normally leads to more downside. It has already dropped below the lower side of this triangle, confirming the bearish thesis.
The fund has remained below the 50-week moving average, a sign that bears remain in control. The current price of $82 is also notable because it was its lowest level in 2023. Therefore, technicals suggest that the fund has more downside in the coming weeks. If this happens, the next key level to watch will be at $80. A move above the key resistance level of $84 will point to more gains.

DocuSign stock forms golden cross as Morgan Stanley boosts target

Micron stock rises 2%, SanDisk gains 3%: why memory stocks are moving again

Nasdaq futures rise 135 points: 5 things to know before Wall Street opens

Norway’s $2.3 trillion wealth fund may cut US Treasury holdings by $75B

Nvidia stock is leading a Mag Seven comeback: why these stocks deserve more attention
No results found
Loading articles...
Failed to load articles. Please try again.