
HYPE price explodes 20% as Hyperliquid moves closer to the US market

AI Sentiment: 78/100 Bullish
This score is generated through AI-driven analysis of the article's content.

powered by

Buy HYPE. US officials signaled a “fully compliant and legal” path for Hyperliquid, and the token is already breaking back toward prior resistance ($73.40) with bullish 4-hour EMA stacking. If HYPE holds above $70 and clears $73.40, the chart points to $80 then ~$83 (upper Fibonacci). Thesis killer: US regulators shut the door or delay “regulated entry” so the rally reverses and HYPE loses $67.50, then $62.
Key Risk: Regulators delay or block a US-compliant pathway, causing HYPE to fall back below $67.50 and unwind the breakout.
Buy BTC. The HYPE surge came alongside broad crypto strength (BTC near $69k, ETH >$2k) and heavy liquidations—classic risk-on momentum. If BTC keeps grinding higher, HYPE’s breakout has a tailwind and consolidation is more likely to be shallow. Thesis killer: BTC breaks down (risk-off) and drags alt perps lower, invalidating the “US-regulated upside” narrative for HYPE.
Key Risk: BTC turns risk-off and breaks down, pulling HYPE and other alts into a sharp selloff.
- HYPE has gained about 19% in 24 hours, breaking above $70.
- Trump said CFTC is working on a compliant US path for Hyperliquid.
- Technical indicators put $73.40 as the next key resistance.
Hyperliquid’s HYPE token has gained 19.6% over the past 24 hours to trade near $70.44 on Aug. 20, after briefly pushing above $72 during a sharp rally triggered by fresh signs of a possible regulated US entry.
CoinGecko data showed HYPE had risen from a close to $58 over the previous 24 hours, with most of the gains arriving in two moves.
The token first climbed through $62 before jumping towards $70, while its seven-day gain stood at 23.2%.
The latest move followed comments from US President Donald Trump at the White House on Aug. 19, when he said Commodity Futures Trading Commission Chair Michael Selig was working to bring Hyperliquid into the US in a “fully compliant and legal fashion.”
HYPE moved above $70 following the remarks, adding to gains that had already started earlier in the session.
Trump’s comments also added new detail to reports from the previous week that Hyperliquid was exploring a regulated route into the US market.
Regulatory records show discussions between the project and US agencies had already taken place before the president’s remarks.
CFTC Innovation Task Force records show Hyperliquid Labs and Hyperliquid Strategic met the regulator on July 15.
The meeting followed talks with the Securities and Exchange Commission’s Crypto Task Force a day earlier.
According to an SEC memorandum covering the July 14 meeting, Hyperliquid representatives discussed the protocol and a “clear, regulated pathway” that could allow Americans to access onchain markets deployed on Hyperliquid.
The regulatory push has become particularly important for Hyperliquid because the decentralised trading protocol specialises in perpetual futures, a product that has faced tighter restrictions for US retail traders than in many offshore markets.
Market conditions also supported the HYPE rally. Bitcoin pushed towards $69,000 during the session, while Ether moved back above $2,000 as crypto prices rose across the market.
The rally came as the US Treasury increased certain longer-dated bond buybacks and the SEC proposed a new framework for crypto offerings.
Nearly $2 billion in crypto positions were liquidated during the market move.
Reuters reported that Trump also used the White House event to urge Congress to move forward with the stalled CLARITY Act, adding another US policy development to a session already dominated by regulatory news.
HYPE price analysis
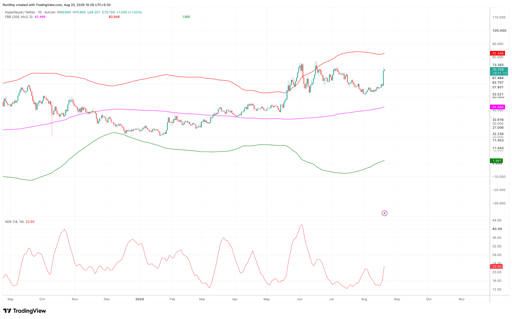
HYPE’s daily chart shows the Aug. 20 rally has pushed the token back towards the upper part of its recent trading structure, but the trend-strength readings have not yet confirmed a fully established strong uptrend.
HYPE/USDT 1-day price chart. Source: TradingView.
The Average Directional Index has risen sharply to 22.60 after dropping towards the low teens earlier in August.
An ADX below 20 usually points to a weak trend, while a sustained move above 25 would provide stronger evidence that the latest breakout is developing into a more established directional move.
Momentum has therefore strengthened considerably, but the ADX would need to continue rising alongside price to support an extension of the rally.
The daily Fibonacci Bands place the upper band near $82.95, giving HYPE a potential upside target if buyers can first clear the recent June and July highs.
The chart also shows an intermediate area around $73.39, close to the zone where previous rallies struggled.
A sustained daily move above $73.40 could therefore open a path towards the $80 psychological level, followed by the upper Fibonacci Band near $83.
A rejection around the current resistance area could instead send HYPE back towards $67.50 and $62, where the latest breakout accelerated.
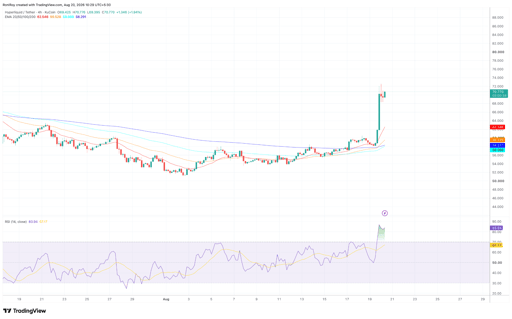
The 4-hour chart gives a stronger bullish reading.
HYPE is trading at $70.77 and well above all four exponential moving averages, with the 20-day EMA at $62.55, the 50-day EMA at $59.53, the 100-day EMA at $58.29 and the 200-day EMA at $58.07. See below.
HYPE/USDT 4-hour price chart. Source: TradingView.
The EMAs are also stacked in bullish order, with the faster averages above the slower ones.
HYPE's sharp distance from the 20 EMA, however, shows how quickly price has separated from its recent trend following the breakout.
At the same time, the four-hour Relative Strength Index has jumped to 83.94, well above the conventional overbought threshold of 70. Its RSI moving average remains lower at 67.17.
An RSI above 80 does not by itself mean the rally has ended, particularly during a strong breakout, but the reading shows short-term momentum is stretched and leaves HYPE exposed to consolidation or a pullback before another attempt higher.
For the bullish case, $72 to $73.40 is now the first area HYPE needs to clear.
A confirmed breakout above that zone would put $80 in play before the daily Fibonacci Band near $82.95, equivalent to an increase of close to 18% from the current price.
On the downside, the 4-hour chart places the first major dynamic support around the 20 EMA at $62.55.
The $58 to $60 region carries additional support from the 50, 100, and 200 EMAs, although a retreat that far would erase a large part of the Aug. 20 breakout.

Bitcoin rises above $68,000 for first time since June as whales resume buying

SUI price rebounds, but collapsing DEX activity raises a bigger concern

SHIB rebounds as traders turn bullish: can it clear the 50-day EMA?

XRP reclaimed $1, so why are traders still refusing to commit?

Ethereum nears $2,000, but why are big investors still holding back?
No results found
Loading articles...
Failed to load articles. Please try again.