
SOL surges past $90 as ETF flows turn stronger: is a run toward $100 underway?

AI Sentiment: 78/100 Bullish
This score is generated through AI-driven analysis of the article's content.

powered by

Buy SOL. The article shows sustained spot ETF inflows (3 straight positive days; $14.6M on Thursday) plus a clean technical setup: SOL is holding above the 200-day EMA (~$89.28) and is pressing toward the next resistance at ~$96.19. Momentum is strong (MAs aligned bullish), and the Treasury liquidity buyback news is a clear macro tailwind for risk assets.
Key Risk: ETF inflows stall or reverse, and SOL fails to hold above the 200-day EMA, triggering a fast momentum unwind.
Buy 1–3 month SOL call spreads (or buy calls) with strikes just above the 200-day EMA break level, targeting a move to ~$96.19. The thesis is that the market is still under-positioned for a sustained breakout: overbought RSI (~79) raises pullback risk, but the positive momentum (MACD) and institutional flow support make dips likely to be bought rather than trend down.
Key Risk: A sharp pullback from overbought conditions turns into a trend break—SOL closes back below ~$89.28 and momentum indicators roll over.
- Solana has gained more than 19% this week, reaching a high of $91.00.
- Solana ETFs attracted $14.60m on Thursday, indicating institutional interest.
- A sustained breakout above $91 could send SOL toward $96.19 in near term.
Solana is extending a powerful weekly rally, climbing more than 19% as improved liquidity expectations and stronger institutional demand support the broader cryptocurrency market.
SOL reached an intraday high of $91.0 on Friday and was trading around $90.90, placing it near a critical technical resistance level that could determine whether the rally continues.
The token’s advance follows a US Treasury announcement expanding debt buyback operations, while fresh inflows into Solana exchange-traded funds point to growing interest from institutional investors.
Treasury buyback expansion boosts Solana and wider crypto market
The US Treasury Department announced plans Wednesday to increase certain buyback operations aimed at improving liquidity in the market for longer-dated Treasury securities.
The Treasury will raise the size of liquidity-support buybacks for longer-dated nominal coupon securities from $2 billion to at least $4 billion per operation.
The move helped ease concerns about market liquidity and increased investor appetite for risk-sensitive assets, including cryptocurrencies.
Solana jumped more than 10% on Wednesday as the announcement contributed to a broader short squeeze across the crypto market.
The rally continued through Friday, with SOL briefly climbing above $90 before facing resistance near its 200-day exponential moving average.
Institutional demand has also strengthened during Solana’s latest advance.
Data from CoinGlass showed that spot Solana ETFs attracted $14.60 million in net inflows on Thursday, marking their largest single-day intake since the end of July.
The inflow also represented the third consecutive day of positive ETF flows this week.
Sustained demand for Solana investment products could provide additional support if institutional buyers continue increasing their exposure.
However, a slowdown in ETF inflows could reduce one of the key sources of momentum supporting SOL’s recent recovery.
SOL faces crucial resistance at the 200-day EMA
Solana was trading around $90.90 on Friday, just above its 200-day exponential moving average at $89.28.
The 200-day EMA represents an important long-term trend indicator and currently serves as immediate resistance.
A sustained move above that level could strengthen the bullish outlook and open the door to the next major resistance area near $96.19.
Reaching $96.19 from $89.14 would represent an additional gain of approximately 7.9%.
SOL remains comfortably above its shorter-term moving averages, with the 50-day EMA at $76.91 and the 100-day EMA at $78.63.
That positioning reinforces the near-term bullish structure, although buyers still need to establish a decisive break above the 200-day EMA.
Despite the strong price action, some technical indicators suggest Solana’s rally may be becoming stretched.
The relative strength index is near 79, placing it firmly in overbought territory and increasing the possibility of a short-term pullback or consolidation.
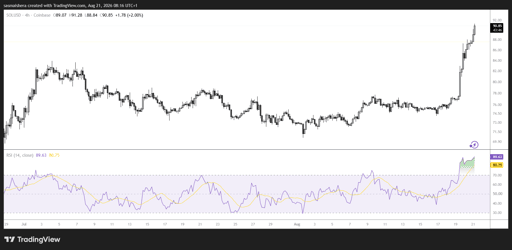
Meanwhile, the moving average convergence divergence remains strongly positive, indicating that bullish momentum is still intact.
If SOL stays above the $89.28 level, support could emerge around the 100-day EMA at $78.63, followed by the horizontal support zone near $77.07 and the 50-day EMA at $76.91.
A deeper correction could expose the former rising trendline near $74.38.
For now, traders are likely to focus on whether Solana can secure a sustained close above its 200-day EMA, a move that could bring the $96.19 resistance level into view.

Ethereum gains 25% as ETF demand strengthens after record $3B short wipeout

Crypto rally today: Why are XRP, Dogecoin, Cardano, Pepe going up?

Bitcoin surges past $76K as buyers pile in: is real demand taking over now?

XRP breaks out as whales scoop 300M tokens: can bulls force a move to $1.50?

How high can ENA go after breaking above $0.12 on heavy volume?
No results found
Loading articles...
Failed to load articles. Please try again.