
Snowflake stock forms bearish divergence as earnings loom: will it rise or crash?

AI Sentiment: 35/100 Bearish
This score is generated through AI-driven analysis of the article's content.

powered by

Buy put options on Snowflake (SNOW) with strikes near $300 (or a put spread $320/$300) for earnings. The thesis is that technical weakness + valuation risk creates a gap-down risk, and options capture the move toward $300 support if the stock “crashes” on guidance or margin disappointment.
Key Risk: A strong beat with confident forward guidance triggers a rally that holds above $341, crushing implied-volatility and making puts lose quickly.
Sell Snowflake (SNOW) into/through the earnings print. The setup is bearish divergence (PPO/RSI rolling over) plus extreme valuation (14x 2027 revenue, ~171 forward P/E). Even if results beat, the market can still punish “priced-for-perfection,” pushing it toward the $300 support area (mean reversion from above 50/100-day EMAs).
Key Risk: Management guides to upside that clearly beats expectations on both growth and margins, forcing the stock to break and hold above $341.
- Snowflake stock has formed a bearish divergence chart pattern.
- The company is expected to publish strong financial results.
- There is a risk that it will have a bearish breakout after earnings.
Snowflake stock has remained in a narrow range in the past few weeks, but this may change later today, September 2nd, when the company publishes its financial results. SNOW was trading at $319.80, down modestly from last month’s high of $341.
Snowflake to publish earnings as growth continues
Snowflake, one of top technology companies that runs one of the biggest data warehousing platform in tech, is seeing robust growth in the AI era. It has seen a surge in demand, with its top clients being firms like Honeywell, Amazon, Siemens Energy, Accor, and Zurich.
The most recent results showed that the company’s growth gained steam in the first quarter of this year. Its revenue jumped by 33% in the first quarter to $1.39 billion, with the net retention rate rising to 126%. This growth was driven by Cortex Code and Snowflake Intelligence.
A closer look at the results showed that customers spending $1 million or more a year rose to 779, a figure that continues its recent uptrend.
Analysts are optimistic that the company’s growth has more room to run as the amount of data growth gains steam. Yahoo Finance data shows that analysts expect the results to show that its revenue jumped by 30% to $1.48 billion. Its earnings per share are expected to move to 45 cents from 35 cents last year.
For the year, the revenue is expected to jump by 30% to $6.1 billion, with the EPS soaring from $1.25 to $1.94. Historically, Snowflake has a long track record of doing better earnings than expected, meaning that the real figure will be better this quarter.
The challenge, however, is that Snowflake is one of the most expensive companies in the US in most metrics. For example, its market capitalization has jumped to over $110 billion, representing 14x of its 2027 revenue.
Its forward price-to-earnings ratio has jumped to 171, much higher than other companies, including fast-growing names like Nvidia and AMD. The only encouraging metric is the Rule-of-40, which looks at a company’s revenue growth and its profit metrics. In this case, based on its free cash flow margin, it has a multiple of 49.7%.
These valuation metrics explain why analysts have a mild outlook for the company. Rosenblatt Securities rose to $345, while Barclays, Benchmark, and Truist have targets of $332, $360, and $360, respectively.
Snowflake stock price technical analysis
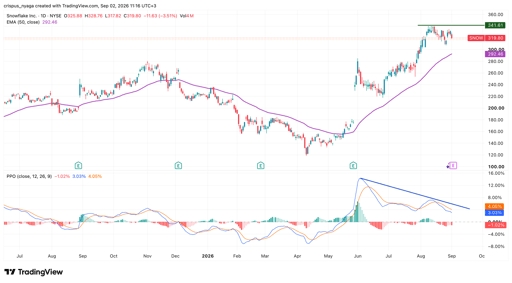
SNOW stock chart | Source: TradingView
Technicals suggest that the SNOW stock may drop in the near future, especially when the earnings come out later today. The Percentage Price Oscillator (PPO) has formed a bearish divergence pattern as it has continued falling in the past few weeks. Similarly, the Relative Strength Index (RSI) has continued falling in this period.
The stock also sits above the 50-day and 100-day Exponential Moving Averages (EMA), meaning that it may go through a mean reversion. Therefore, the stock may drop to the key support level of $300. A move above the key resistance level of $341 will invalidate the bullish outlook.

Why is MongoDB stock falling 13% despite strong Q2 results

Dow rises 200 pts as AI stocks support sentiment amid Iran, yield concerns

Uber stock rises as company cuts 3,300 jobs: here's what investors should know

HPE stock forms rare cup-and-handle pattern as Dell earnings set up key catalyst

Nasdaq futures plunge 200 points: 5 things to know before Wall Street opens
No results found
Loading articles...
Failed to load articles. Please try again.