US growth masks deepening divide in jobs, wealth and spending

The US economy is expanding at a pace that would normally silence most critics.
GDP is growing at a healthy rate, payrolls continue to rise, and equity markets sit near record highs.
But the story that often goes untold is that three-fifths of Americans feel that the country is in recession.
The gap between data and lived experience is now large enough to deserve its own analysis.
What looks like resilience at the top level reveals a deeper realignment once you look at who owns assets, who drives spending and where jobs are actually being created.
Where are the jobs really coming from?
Since early 2025, the US economy added roughly 359,000 jobs.
Private sector payrolls rose by more than 600,000 while government employment declined.
On the surface, this resembles a normal expansion.
The sector breakdown tells a different story. Goods-producing employment fell over the same period.
Trade and transportation showed weakness. Leisure and hospitality improved only modestly.
Almost all net job growth came from health care and social assistance.
Within that, home health aides, nursing facilities, hospitals and ambulatory services accounted for the bulk of gains.
This aligns closely with demographics. The share of Americans aged 65 and over has risen from 13% in 2008 to about 18% today.
The oldest baby boomers are turning 80.
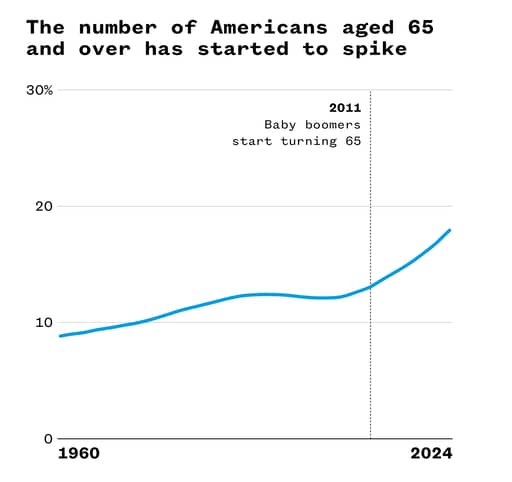
Demand for senior housing and advanced care typically accelerates in the early 80s, according to the National Investment Center for Seniors Housing and Care.
Employment growth is therefore tracking age distribution more than industrial policy or trade strategy.
Health services are labour-intensive and historically show slower productivity growth than manufacturing or technology.
When most incremental hiring occurs in those sectors, headline employment looks healthy while long-term output per worker faces limits.
Who owns the wealth?
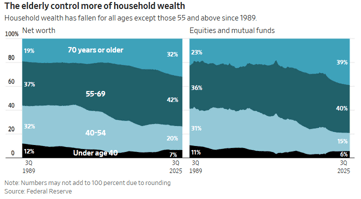
Federal Reserve data show that Americans aged 70 and over now control roughly 32% of household net worth, up from about 20% two decades ago.
Their share of equities and mutual funds stands near 39%, compared with 22% in 2007.
The average net worth of US households aged 65 to 74 reached about $1.8 million in 2022, inflation-adjusted, up 178% from 1989. Median wealth in that age bracket was around $410,000.
Nearly 80% of seniors own their homes, according to Census Bureau figures. Many hold them without a mortgage.
Social Security, when valued as a lifetime annuity, adds substantial financial security.
Decades of rising stock prices and housing appreciation have rewarded those who entered asset markets in the 1980s and 1990s.
The capital share of national income has trended upward, which further boosts returns for asset holders.
Wealth in the United States has grown across much of the distribution since 2010, yet concentration at the very top remains striking.
Federal Reserve data show that the bottom 50% held about $4.25 trillion in wealth by the third quarter of 2025, up sharply from $330 billion in 2010.
The top 0.1% held close to $24.9 trillion, nearly six times as much as the entire bottom half combined.
The centre of gravity in the asset market now sits firmly with older and higher-income households.
From K-shaped to E-shaped
Spending and wage data suggest that the earlier K-shaped pattern has become more layered.
Bank of America internal card data show that in January higher-income households increased spending by 2.5% year over year.
Middle-income households grew about 1%, while lower-income households saw just 0.3% growth.
After tax wage growth shows a similar split. Higher income earners recorded roughly 3.7% growth year over year.
Middle income households saw around 1.6%. The gap between the top and the middle is the widest in several years.
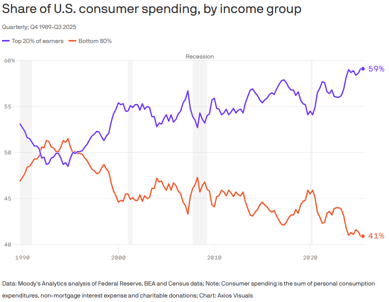
Consumer spending remains strong in aggregate, yet Moody’s analysis indicates that the top 20% of households now account for a disproportionate share of that growth.
Lower-income households face higher effective inflation because groceries and shelter represent a larger share of their budgets.
Morgan Stanley research shows that food and housing inflation outpaced many other categories between 2020 and 2025.
The Atlanta Fed has also documented higher food price growth in lower-income regions over long periods.
That's why households are adjusting, with a higher share of consumers now paying off credit card balances in full, compared with 2019.
Spending at discount grocers has outpaced premium retailers for several years.
Consumers are not collapsing, although they are clearly managing tighter budgets.
Fiscal weight and political reach
Federal spending patterns reinforce the demographic tilt.
In 2019, the federal government spent more than $29,000 per person aged 65 and over through Social Security, Medicare and related programs, according to research by the Aspen Economic Strategy Group.
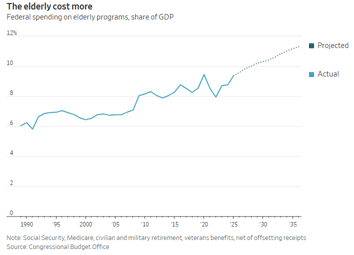
Spending on elderly programs rose from 6.9% of GDP in 2007 to 9.4% recently and is projected by the Congressional Budget Office to reach 11.3% within a decade.
By 2032, Social Security will not be able to pay full scheduled benefits without reform.
At the same time, wealth concentration at the top has translated into greater political financing capacity.
The number of US billionaires rose from 404 in 2010 to 748 in 2023.
Their share of political contributions increased by 1700% over the same period, according to Americans for Tax Fairness.
After the 2010 Citizens United ruling, restrictions on independent political spending weakened significantly.
Large fortunes can fund campaign vehicles, media acquisitions and policy institutions in ways that smaller fortunes cannot.
Political scientists have long argued that concentrated interests exert stronger influence than diffuse groups.
When the scale of wealth rises sharply at the very top, the ability to absorb the fixed costs of political engagement also rises.
Growth without broad comfort
The US economy in early 2026 is neither fragile nor uniformly strong.
However, job creation is concentrated in care services. Asset ownership is heavily skewed toward older households.
Spending momentum is strongest among higher-income earners. Labour’s share of output has declined relative to profits.
Nearly 60% of Americans believe the country is in recession.
That belief coexists with expanding output. Both signals can be understood once the distributional structure is examined.
For investors, the picture is clear. Demographics will continue to drive health care demand and employment.
Asset prices remain central to household balance sheets and consumption trends.
Fiscal pressures will build as entitlement spending rises relative to GDP.
The dividing lines are not between growth and contraction but between those tied to capital and those tied primarily to wages.
The expansion continues, but it's clear that its benefits do not flow evenly.

US consumer sentiment improves as gasoline prices ease but sentiment remains subdued

UK retail sales fall sharply in June amid weak consumer sentiment

Copper rises, but outlook murky amid US policy risk and weak China demand

UK business activity falls again in June amid weak demand and job cuts

Starmer to step down; markets eye Burnham's fiscal plans and chancellor pick
No results found
Loading articles...
Failed to load articles. Please try again.