Bitcoin stalls near $75K amid profit-taking: is breakout still possible?

AI Sentiment: 42/100 Bearish
This score is generated through AI-driven analysis of the article's content.
powered by
Buy BTC (spot or long BTC perpetuals) for a push through $76,132 toward $79,395. Setup: profit-taking is present (RPL ratio up; STH in profit only 43.2%), but participation is still fragile, so upside can extend before the next wave of selling. Institutional demand is turning positive and CME OI is recovering, while liquidity remains the key driver—short liquidations cluster $74k–$76k, creating a squeeze fuel if price reclaims $76k. Funded rate is slightly negative (-0.0056%), limiting immediate crowded longs.
Key Risk: BTC fails to reclaim $76,132 and instead breaks down through $73,395, triggering liquidation-driven selling that overwhelms the fragile recovery.
Sell BTC risk by owning a put spread (e.g., long 1-month 73k put, short 70k put) or equivalently a defined-risk bearish hedge into the $74k–$76k chop. Rationale: OI-weighted funded rate flipped negative and the 4-hour structure is still bearish/efficient; momentum has cooled (RSI down from 74; IV down). If the market corrects, first major resistance is $76k and the first major downside magnet is $73,395, then $70,441.
Key Risk: A clean breakout above $76,132 with sustained participation lifts BTC toward $79,395, causing put spread decay and losses.
- Bitcoin is up by 1% and is trading around $75,000.
- Market momentum has stabilized over the past few hours.
- BTC could rally past $76,132 resistance if the buying pressure resumes.
The cryptocurrency market has been stable over the past few hours, with no significant price movement among the leading cryptocurrencies.
Bitcoin has stabilized around the $75,000 area after rejecting the $76,132 resistance level earlier this week. The leading cryptocurrency could rally higher in the near term as demand remains stable.
Bitcoin shows signs of stabilization
Glassnode revealed in its report on Wednesday that Bitcoin is beginning to show signs of stabilization after a prolonged period of losses. However, the report added that the recovery remains fragile and lacks strong participation.
Bitcoin is currently trading at $74,900, 5% below the True Market Mean at $78,100, a key resistance level that represents the average cost basis of active on-chain supply.
Glassnode noted that the current stall in Bitcoin’s price movement can be attributed to increased profit-taking.
The 30-day Exponential Moving Average of the Realized Profit/Loss Ratio has risen to 1.16, indicating that more investors are selling into recent price strength.
The report revealed that only 43.2% of Short-Term Holder (STH) supply is currently in profit, below the historical average of 54.2% observed at local peaks during bear-market rallies.
This indicates that there may be room for further gains before the market experiences selling pressure.
Institutional demand for Bitcoin has turned positive over the past few weeks, while open interest on CME Group futures has begun to recover from recent lows.
However, both indicators remain well below levels seen during previous periods of strong risk appetite, suggesting that capital is re-entering the market cautiously rather than aggressively.
Glassnode further pointed out that liquidity conditions are the primary movers of Bitcoin’s price action. Data obtained from Hyperliquid reveals a concentration of long liquidations between $63,000 and $65,000, while short liquidations are clustered around $74,000 to $76,000.
Derivatives data show that retail demand in the market has been increasing in recent days. CoinGlass’s futures Open Interest (OI) for Bitcoin now reads $56.95 billion, up by 11% from the $51 billion recorded on Wednesday.
However, the OI-weighted funded rate has flipped negative and now reads -0.0056%. The funding rate flipping negative means that the bears are slowly regaining control of the market.
Additional derivatives indicators reinforce the cautious outlook. Implied volatility has declined, with one-month implied volatility near 42.6%, reflecting calmer market conditions after recent turbulence.
Bitcoin technical outlook: Bulls face resistance at $76,132
The BTC/USD 4-hour chart remains bearish and efficient. Bitcoin is looking to retest the resistance level above $76,000, but could face further selling pressure in the near term.
The momentum indicators suggest the bullish narrative may be fading. The RSI of 63 is above the neutral 50, but has dropped from the overbought 74 recorded earlier this week.
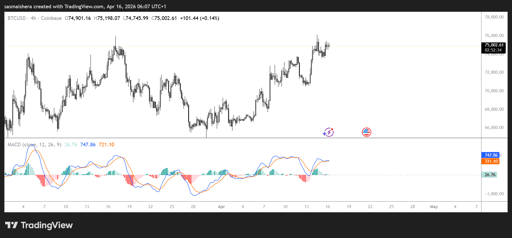
The MACD lines are also above the zero line, indicating a stabilizing bullish condition. If buying pressure resumes, BTC could surpass the $76,132 resistance level and rally towards the $79,395 daily swing high.
However, if the market undergoes a correction, Bitcoin could encounter its first major resistance at the Wednesday low of $73,395, with another floor at $70,441.

Can Shiba Inu coin price extend its rally as 1T tokens leave exchanges?

Strategy stock jumps as Bitcoin buying pause enters fifth straight week

Cardano price prediction: Can ADA break above $0.17 or is another drop ahead?

Bitcoin price holds above $65K as Fed rate decision, ETF flows shape market outlook

Can XRP break above $1.12 as ETF optimism builds around the token?
No results found
Loading articles...
Failed to load articles. Please try again.