Will XLM hit $0.1800 amid a surge in transaction activity?

AI Sentiment: 72/100 Bullish
This score is generated through AI-driven analysis of the article's content.
powered by
Buy XLM outright. The catalyst is real: Stellar processed 14.19M transactions (quarterly high), funding flipped positive (0.011%) and futures OI rose ($94.73M), signaling fresh long liquidity. Price action already broke the descending trendline (~$0.158) and RSI/MACD suggest downside momentum faded. Target $0.180 (100-day EMA/4h swing high), then $0.201 (23.6% fib).
Key Risk: A daily close back below $0.158 (trendline break failure) that flips funding/OI back bearish and invalidates the on-chain-driven bid.
Go long XLM perpetual futures for faster capture of the funding/OI squeeze. Positive funding plus rising OI implies longs are being added and can accelerate price via forced positioning. Use the $0.180 area as the first take-profit; let a runner target $0.201 if momentum holds.
Key Risk: Funding turns negative or OI collapses while price stalls under the $0.180–$0.181 EMA cap, indicating the long squeeze is over.
- XLM is up 3.5%, making it one of the best performers in the top 20.
- The rally comes amid a surge in network activity and retail demand.
- XLM could extend its rally towards the $0.1800 4-hour swing high.
Bitcoin (BTC) and Ethereum (ETH) are currently trading in the red, but Ripple (XRP) is outperforming the broader cryptocurrency market.
Stellar (XLM) moves similarly to XRP as they are both cross-border tokens. However, XLM is currently outperforming XRP as it is up 3.5% in the last 24 hours.
XLM briefly hit the $0.169 level on Friday, after breaking above the descending trendline and rallying over 10% so far this week.
The bullish sentiment continues to increase as XLM’s network transactions reach a quarterly high, alongside positive funding rates and bullish momentum indicators.
XLM rally as network activity reaches a quarterly high
XLM is one of the best performers among the top 20 cryptocurrencies by market cap. The positive performance comes amid improving on-chain data.
Chainspect, a blockchain fundamentals tracker, revealed that Stellar processed over 14.19 million transactions on Thursday, its highest level in the past quarter.
These surging transactions highlight increased interest and liquidity among traders in the XLM, supporting a bullish outlook.
The improvement in XLM’s on-chain data is also supported by retail demand from leveraged traders.
Data obtained from CoinGlass shows that XLM’s funding rates have also flipped positive on Monday and read at 0.011% on Friday.
This shows that the longs are paying the shorts. Usually, when funding rates have turned positive and surged, the XLM price has rallied sharply.
The futures Open Interest (OI) also reads $94.73 million on Friday, up from the $82 million recorded last week.
The increasing OI and the surging network activity could push XLM’s price higher in the near term, with the bulls already targeting a 4-hour swing high.
XLM price forecast
Similar to XRP, the XLM/USD 4-hour chart is bearish and efficient. XLM is currently trading at $0.1645, after breaking above the descending trendline at $0.1580 the previous day.
XLM is now maintaining a corrective tone below the medium- and long-term Exponential Moving Averages (EMAs).
The coin is trading below the 100-day EMA at $0.180 and well under the 200-day EMA at $0.215, levels that could cap upward movement in the near term.
The 50-day EMA at $0.164 now offers nearby dynamic support. The momentum indicators suggest that the bulls could push XLM’s price higher in the near term.
The Relative Strength Index (RSI) at 65 and a slightly positive Moving Average Convergence Divergence (MACD) histogram hint that downside momentum has faded, with a bullish breakout now forming.
If the rally persists, initial resistance is seen at the 100-day EMA around $0.180, which coincides with the 4-hour swing high.
The next resistance level lies at the the 23.6% Fibonacci retracement of the broader downswing at $0.201, with the 200-day EMA near $0.2159 also another interesting level.
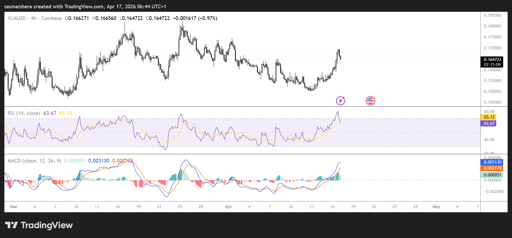
On the downside, immediate support is seen at the 50-day EMA at $0.164, ahead of the former trendline break area near $0.158.
A daily candle close below this level would expose the $0.136 swing low region, where the Fibonacci anchor creates a more substantial floor.

Injective price forecast: Coinbase integration strengthens bullish case for INJ

Bitcoin price outlook: treasury sell-offs, Poolin bankruptcy and $1.2B options expiry

How high can BEAT go as whale withdrawals drain exchange supply?

ONDO price jumps 10%: did FINRA just unlock its biggest US opportunity?

TRX tests $0.33 resistance: is Tron's gasless payment boom enough?
No results found
Loading articles...
Failed to load articles. Please try again.