Bitcoin rebounds above $80K as traders bet on CLARITY Act momentum

AI Sentiment: 58/100 Bullish
This score is generated through AI-driven analysis of the article's content.
powered by
Buy BTC. The article shows fresh capital still entering (30-day realised cap net position change +$2.8B/month) and price is reclaiming $80K after long liquidations. The market is also explicitly waiting on the CLARITY Act; any positive Senate Banking progress should lift institutional confidence and help BTC clear the $82K resistance that’s been rejecting repeatedly.
Key Risk: CLARITY Act momentum disappoints and BTC loses $76,800, triggering a deeper selloff toward the low-$70,000s.
Sell/short US spot Bitcoin ETF exposure (e.g., IBIT) versus BTC. The news flags the largest single-day ETF outflows (~$635M on May 13). If macro stays tight (hot PPI → higher-for-longer) while ETF flows remain negative, ETFs can underperform BTC during rebounds driven by technical squeezes and headlines.
Key Risk: ETF outflows reverse sharply (new sustained inflows) and BTC’s rally turns into a clean trend above $82K.
- Bitcoin price briefly fell below the $80,000 mark earlier in the day.
- Bitcoin ETFs posted $635 million in outflows after hot inflation data.
- Traders now await the Senate CLARITY Act markup for fresh market direction.
Bitcoin traded above $80,000 after slipping briefly after inflation data, ETF outflows, and heavy long liquidations weakened bullish momentum across the crypto market.
Glassnode stated in its latest Week On-chain report that Bitcoin’s 30-day realised cap net position change recently climbed to $2.8 billion per month, showing that fresh capital is still entering the market, though at a much slower pace than during previous breakout periods in the 2023 to 2025 rally.
The analytics firm said weaker inflows have raised questions about whether Bitcoin can sustain a move above the $80,000 to $82,000 range.
Around the same time, SoSoValue data showed US-listed spot Bitcoin ETFs recorded roughly $635.23 million in net outflows on May 13, the largest single-day withdrawal since January.
Pressure on Bitcoin accelerated after the US Producer Price Index data came in above expectations.
The latest PPI reading rose 6% year over year, following a hotter-than-expected CPI report earlier in the week.
Traders interpreted the data as a sign that the Federal Reserve may keep interest rates elevated longer than previously anticipated, reducing appetite for speculative assets.
Alongside the macro pressure, Bitcoin also failed once again to clear resistance near its 200-day moving average.
According to the additional market analysis provided, the technical level has rejected Bitcoin multiple times over the past two weeks as buyers struggled to maintain momentum above the psychological $80,000 mark.
Long liquidations add to market stress
In derivatives markets, leveraged bullish positions faced heavy losses as Bitcoin dropped below key support.
According to Coinglass, roughly $370 million in crypto positions were liquidated over the past 24 hours, with long traders accounting for most of the wipeout.
The report described the move as a long squeeze that intensified selling pressure once stop losses began triggering across the market.
Bitcoin researcher Axel Adler Jr. also pointed to fading buyer aggression across spot and futures markets.
Adler said the 30-day net taker volume indicator fell from +2.0 on May 6 to +1.25 this week, showing buyers have become less aggressive after Bitcoin’s push above $80,000.
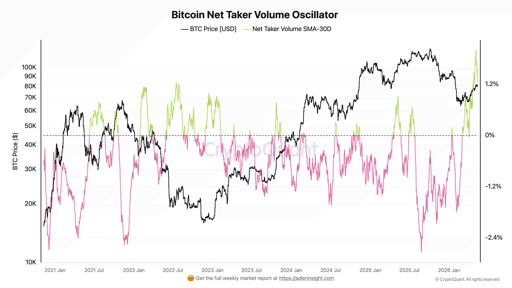
Bitcoin Net Taker Volume Oscillator SMA-30D chart. Source: Axel Adler Jr.
At the same time, Bitcoin funding rates have remained negative since March, signaling that bearish positioning still dominates futures activity.

Bitcoin Funding Rate SMA-30D chart. Source: Axel Adler Jr.
Adler noted that a return above zero in funding rates would provide a stronger indication that traders are rebuilding bullish positions.
Additional pressure has come from global macro uncertainty.
Concerns surrounding Iran-US tensions and rising oil prices have pushed some investors toward traditional safe-haven assets such as gold and the US dollar.
WTI crude futures remained above $101 per barrel after fresh US sanctions targeted entities tied to Iranian oil sales to China, which has continued to pressure risk assets like Bitcoin.
Traders watch CLARITY ACT progress and ETF demand
Even with the latest correction, institutional demand has not disappeared entirely.
Spot Bitcoin ETFs still attracted more than $1 billion in net inflows over the past week despite the recent decline below $80,000, suggesting some long-term allocators continue viewing current levels as attractive entry points.
Attention has also turned toward Washington, where the US Senate Banking Committee is handling the Digital Asset Market CLARITY Act.
The legislation would formally define the regulatory framework surrounding digital assets and remove uncertainty tied to enforcement-based oversight.
Positive progress on the bill could improve institutional confidence in the crypto sector, which could help Bitcoin gain momentum above $80,000 and break past the resistance around $82,000 that kept price action suppressed earlier in the week.
On the downside, traders are focused on the $76,000 to $76,800 range now stands as a key area for bulls to defend if the markup doesn’t play out in favour of Bitcoin because it aligns with Bitcoin’s 50-day and 100-day exponential moving averages.
Failure to stabilise above those levels could expose Bitcoin to a deeper correction toward the low-$70,000 region.
At press time, Bitcoin price had moved back above $80,000 as traders were pricing in the CLARITY Act.

Uniswap price forecast: Can UNI break $3.58 ahead of crucial governance vote?

XRP price eyes breakout as traders watch familiar technical pattern

Are Ethereum bulls preparing a major breakout above the 100-day EMA?

PEPE price coils below its 50-day EMA as breakout pressure intensifies

Why are ADA traders betting against Cardano after a landmark hard fork?
No results found
Loading articles...
Failed to load articles. Please try again.