BNB slides as ETF enthusiasm fades and bearish signals mount

AI Sentiment: 12/100 Bearish
This score is generated through AI-driven analysis of the article's content.
powered by
Sell/short BNB. Price is below the 50/100/200-day EMAs ($636/$655/$702), RSI (~38) isn’t oversold, and MACD is still negative. The megaphone pattern points to continued volatility and downside, and $560–$570 is the key support zone—if it breaks, there’s room for a fast move lower. The BNB ETF (VBNB) has near-zero inflows, so there’s no institutional “floor.”
Key Risk: BNB reclaims the $636–$655 EMA band and then holds above $700–$750, flipping resistance back into support and forcing shorts to cover.
Sell crypto beta: short BTC (e.g., BTC perpetuals) and/or reduce ETH exposure. The article shows BTC failing to hold $62,000 and broader crypto losing value as risk appetite fades. With inflation keeping rate expectations higher into September, capital is rotating out of crypto toward AI/high-growth equities—so BNB weakness likely drags the whole complex.
Key Risk: A macro reversal (rate-cut repricing) plus BTC reclaiming and holding above $62,000 triggers a broad crypto rebound that lifts BNB and offsets the macro headwind.
- Binance coin (BNB) has erased its rally, falling over 16% from recent highs.
- Weak ETF inflows and bearish trader sentiment pressure BNB.
- A break below $570 could expose downside toward $500.
BNB faced renewed selling pressure after being rejected near $608 on June 9 and falling back below $585.
The decline has extended losses from its recent peak of $720, leaving the token down more than 16% from that high.
The pullback marks a sixth consecutive day of declines, effectively erasing a short-lived rally that had raised hopes of a broader recovery.
The weakness has not been limited to BNB. Bitcoin has also struggled to hold above $62,000, while the broader cryptocurrency market has lost significant value in recent weeks.
Macro conditions remain a key headwind. Persistent inflation in the US has led investors to reassess the outlook for monetary policy, with expectations shifting toward a potential 25-basis-point interest-rate increase in September.
That contrasts sharply with the start of 2026, when markets were largely expecting one or two rate cuts.
As risk appetite has weakened, capital has increasingly rotated away from cryptocurrencies and toward sectors tied to artificial intelligence and high-growth technology equities.
The BNB ETF launch changed nothing
The launch of the first BNB spot ETF in the United States on May 28 was supposed to be a tailwind for the token.
But it has not played out that way.
VanEck's BNB ETF, trading under the ticker VBNB, has attracted only around $2 million in net inflows since its debut, according to VanEck's data.
For context, comparable ETFs tied to XRP and Solana pulled in hundreds of millions within similar timeframes.
SoSoValue data confirms that BNB's spot ETF products have seen virtually no meaningful daily inflows since launch.
The absence of institutional buying removes what would have been a significant floor for the price, and the market has taken note.
On-chain data and derivatives both point to a bearish trend
Santiment's Social Dominance metric for BNB fell to just 0.019%, a level last seen in December 2020.
This index measures BNB's share of total discussion across crypto media.
A reading this low means the token has effectively dropped off traders' radar, which tends to correlate with continued price weakness rather than a reversal.
CoinGlass data adds to the bearish case, with the long-to-short ratio for BNB sitting at 0.91, meaning short positions outnumber longs by a meaningful margin.
A long-to-short ratio below 1.0 signals that the majority of derivatives traders are positioned for further downside.
On top of that, funding rates have turned negative, shorts are now paying longs to keep their positions open, which reflects how lopsided bearish positioning has become in the perpetual futures market.
Binance coin price analysis
BNB is currently trading below all three of its key exponential moving averages (EMAs).
The 50-day EMA sits at $636, the 100-day at $654.82, and the 200-day at $702.03.
These levels form a layered ceiling of resistance that any recovery attempt will need to clear before momentum can shift.
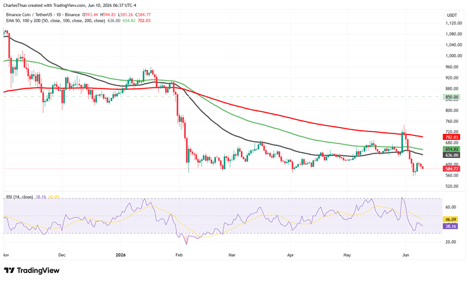
The RSI is also sitting around 38, which is approaching but not yet at oversold territory.
The MACD is negative and shows no sign of a bullish crossover.
Looking at these technical indicators, neither is giving any recovery signal at this point.
In addition, BNB has formed a megaphone pattern on the daily chart, a broadening structure defined by rising highs and falling lows.
This type of pattern typically appears during periods of elevated uncertainty and expanding volatility.
BNB was rejected near the upper boundary of this formation around $720 on May 31, 2026, before falling sharply toward the lower boundary near $560.
The current price of $583 sits just above that lower boundary, making the $560–$570 zone the most critical area on the chart right now.
In addition, BNB broke below a multi-year ascending trendline on the weekly chart that had been in place since late 2023.
The rally toward $720 attempted to reclaim that trendline but failed, and former support in that region has now flipped into resistance in the $700–$750 range.
Weekly RSI has also dropped to around 40 and is sitting below its signal line, while the weekly MACD remains below zero.

JTO price prediction as Jito launches JTX self-custodial trading platform

Zcash price prediction: Can ZEC break above $562 after the Ironwood upgrade?

SUI price prediction: Bullish accumulation signals build

Interview: Agentic AI to drive blockchain adoption, says Animoca Brands' Evan Auyang

ONDO price jumps 13%: can DTCC link drive a bigger breakout?
No results found
Loading articles...
Failed to load articles. Please try again.