Will Bitcoin price fall below $60,000 again?

AI Sentiment: 18/100 Bearish
This score is generated through AI-driven analysis of the article's content.
powered by
Buy Bitcoin (BTC-USD spot) for a bounce off the $60,000 support/liquidity cluster ($60,600–$60,800). The article flags a large liquidation pool just above price and another at ~$60,000; if $60k holds, forced short liquidations can push BTC toward $62,500–$64,000 and potentially $63,000 (mid-$63k). This is a direct play on support holding amid risk-off headlines.
Key Risk: Geopolitical escalation keeps worsening and BTC breaks and holds below $60,000, triggering forced liquidations into the $50,000–$59,000 liquidity gap.
Sell/avoid US spot Bitcoin ETF exposure (e.g., iShares Bitcoin Trust/IBIT, Fidelity Wise Origin Bitcoin Fund/FBTC, ARK 21Shares/ARKB) because the article cites ~$4.4B net outflows mid-May to early June and total ETF assets falling from $100B+ to below $80B. With institutional demand deteriorating and macro (higher-for-longer yields) still pressuring speculative assets, flows likely stay negative until the $60k level stabilizes.
Key Risk: ETF outflows reverse sharply (sustained inflows) and BTC reclaims key resistance (back above ~$67,876), proving the selloff is over.
- Bitcoin is holding just above the key $60,000 support level.
- ETF outflows and geopolitical tensions have added selling pressure.
- Charts and liquidation data show further downside risk if $60,000 breaks.
Bitcoin extended its downturn that began on Monday as it fell back toward the critical $60,000 level, as geopolitical tensions and an overall lack of demand continue to weigh on sentiment.
According to Coingecko data, Bitcoin dropped to an intraday low of $60,892 on June 9 before recovering modestly to trade around $61,800.
The flagship crypto was down roughly 3% over the previous 24 hours, while the total cryptocurrency market also stayed under pressure.
What’s behind the drop?
Fresh selling emerged after US President Donald Trump announced a military response against Iran following an incident involving an American Apache helicopter near the Strait of Hormuz.
Trump said the United States "must, of necessity, respond to this attack," after which US Central Command launched retaliatory strikes.
Iranian Deputy Foreign Minister Kazem Gharibabadi disputed the accusation, saying Iranian forces had not intentionally targeted the aircraft and suggesting the incident occurred as a result of heightened military activity in the region.
Concerns that the ceasefire established earlier this year could break down sent investors toward traditional safe-haven assets.
Gold climbed 1.8%, while WTI crude oil gained 3.5% on fears of potential supply disruptions. US equity futures also moved lower as risk appetite weakened.
Pressure on Bitcoin had already been building before the geopolitical escalation.
Ahead of the May Consumer Price Index report due on June 10, traders became increasingly cautious amid expectations that inflation could accelerate again.
Rising Treasury yields have also added to concerns that the Federal Reserve may keep interest rates elevated for longer, reducing demand for speculative assets.
Another challenge has come from a lack of fresh capital entering crypto markets.
According to Wintermute, institutional demand has continued to deteriorate in recent weeks, leaving Bitcoin vulnerable to further downside.
The trading firm previously reported that US spot Bitcoin ETFs experienced roughly $4.4 billion in net outflows between mid-May and early June, while total ETF assets declined sharply from more than $100 billion to below $80 billion during the same period.
Wintermute also noted that capital has increasingly flowed into artificial intelligence-related investments and major equity opportunities, including preparations for the anticipated SpaceX IPO, creating additional competition for investor funds.
Can Bitcoin fall below $60,000?
Technical indicators suggest Bitcoin remains under pressure despite holding above the recent intraday low.
On the daily chart, Bitcoin is trading below its 20-day EMA at roughly $67,876, its 50-day EMA near $71,917, its 100-day EMA around $74,191, and its 200-day EMA at approximately $79,394.
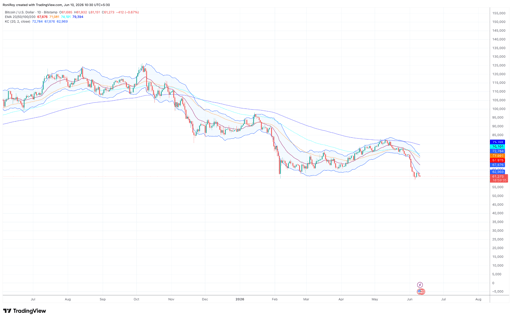
BTC/USD 1-day price chart. Source: TradingView.
Price has also fallen below the lower Keltner Channel boundary near $62,969, showing that downside momentum remains strong and that Bitcoin is trading outside its typical volatility range.
The recent structure shows a series of lower highs and lower lows after Bitcoin failed to maintain its recovery toward the $80,000 area in May.
A move back above the lower Keltner Channel near $62,969 would be the first sign that selling pressure is easing.
Beyond that, Bitcoin would need to reclaim the 20-day EMA at roughly $67,876 before the technical outlook begins to improve.
For now, support around $60,000 has become increasingly important.
Wintermute identified a liquidity gap between $50,000 and $59,000, warning that downside moves could accelerate if current support levels fail to hold.
Meanwhile, the latest CoinGlass 24-hour liquidation heatmap shows one of the largest liquidity clusters sitting between roughly $60,600 and $60,800.
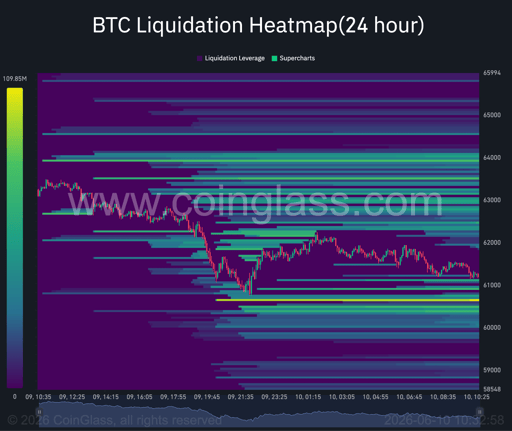
Bitcoin liquidation heatmap. Source: Coinglass.
Markets often gravitate toward these zones because concentrated leverage creates attractive liquidation targets.
Below that area, another concentration of liquidity appears near $60,000.
A decisive break beneath current support could therefore trigger another round of forced liquidations and expose the market to a test of the upper end of Wintermute's identified $50,000-$59,000 range.
At the same time, the heatmap shows substantial liquidity stacked above current price between approximately $62,500 and $64,000.
Should Bitcoin attract buyers and reclaim $62,000, those positions could fuel a short-covering move toward the mid-$63,000 region.

Interview: Agentic AI to drive blockchain adoption, says Animoca Brands' Evan Auyang

ONDO price jumps 13%: can DTCC link drive a bigger breakout?

Can Dogecoin whales spark a breakout as open interest tops $1.11B?

WLD price jumps 5%: Can Grayscale’s ETF filing fuel a bigger rally?

XRP price storms past $1.10 as traders pile back into leveraged bets
No results found
Loading articles...
Failed to load articles. Please try again.