Ethereum price forecast: can ETH break $1,780 after US-Iran risk rally?

AI Sentiment: 68/100 Bullish
This score is generated through AI-driven analysis of the article's content.
powered by
Buy Ethereum (ETH-USD spot) for a momentum squeeze toward $1,778, with a path to $1,942 if ETH holds above $1,668 and gets a daily close over $1,778. The news is a clear risk-on catalyst (US–Iran peace + Strait of Hormuz reopening) and the 4-hour chart is already flipping bullish (above 20/50 MAs; MACD buy conditions).
Key Risk: A Fed-driven risk-off reversal (hawkish surprise) that drags crypto back below $1,668, killing the breakout attempt.
Sell ETH perpetual futures (short on strength) targeting a fade of the overbought stretch: RSI ~64 and multiple indicators flag “stretched” conditions after a fast 3% pop. If ETH fails to hold $1,778 on a daily basis, expect a quick mean reversion back toward the $1,668 pivot.
Key Risk: ETH gets the daily close above $1,778 and momentum accelerates toward $1,942, forcing shorts to cover.
- Ethereum has topped the $1,700 level after adding nearly 3% to its value.
- The rally comes following a deal between the United States and Iran.
- Ethereum could extend its rally towards $1,942 resistance level in near term.
Ethereum experienced a sharp selloff in June 2026 as multiple macroeconomic and geopolitical pressures weighed on broader crypto market sentiment.
Key factors behind the decline include escalating US–Iran tensions, heightened geopolitical risk, a more hawkish stance from the Federal Reserve, and notable outflows from spot crypto exchange-traded funds.
Together, these forces have increased uncertainty across both institutional and retail market participants.
However, the macroeconomic conditions are improving, with Ethereum now approaching the $1,800 level after adding nearly 3% to its value in the last 24 hours.
Middle East deal bolsters cryptocurrencies
The primary catalyst behind Ethereum’s rally over the last 24 hours is the US-Iran deal.
Reports on Sunday revealed that the two countries have agreed to a peace deal that will take effect on Friday.
According to President Donald Trump, the US will lift its naval blockade and the Strait of Hormuz will reopen after the agreement is signed.
Analysts noted that the markets are repricing risk after reports of a US-Iran peace deal and the reopening of the Strait of Hormuz, triggering a broad risk-on move across assets.
The rally over the past 24 hours is driven by positioning and risk rotation rather than a shift in underlying fundamentals.
Analysts and investors are now focusing their attention on the upcoming Fed meeting. The new Fed Chair, Kevin Warsh, is set to preside over his first Fed meeting.
The US-Iran deal and the subsequent decline in crude oil prices could bolster Warsh’s argument for rate cuts.
This provides some much-needed relief for cryptocurrencies, even if an actual rate cut is still an unlikely prospect this year.
Ethereum’s technical structure switches bullish
Similar to other leading cryptocurrencies, the ETH/USD 4-hour chart has also flipped bullish.
Ethereum’s short-term chart is showing signs of improvement, with ETH trading above its 20-period and 50-period moving averages on the four-hour chart, suggesting buyers are defending near-term support.
However, the broader trend remains weak as ETH continues to trade below its 200-day moving average near $2,409, keeping longer-term bearish pressure intact.
Immediate support is seen around the recent low of $1,668.10, which is now acting as a key short-term pivot zone.
Momentum indicators show a split outlook between bullish continuation and overbought exhaustion.
RSI stands at 64, indicating positive momentum but approaching overbought territory.
Meanwhile, the MACD continues to signal buy conditions, while the Stoch RSI, CCI, and BBP suggest overbought conditions, implying the recent rally may be stretched.
Overall, the data suggests buyers are still active, but the strength of the trend remains uncertain.
If the rally continues, Ethereum could push its price towards the first major resistance level at $1,778.
A daily close above this level could pave the way for an extended rally towards the $1,942 resistance zone.
However, if the bearish trend returns, the bulls would need to defend the $1,668 support level to enable a quick bounce back.
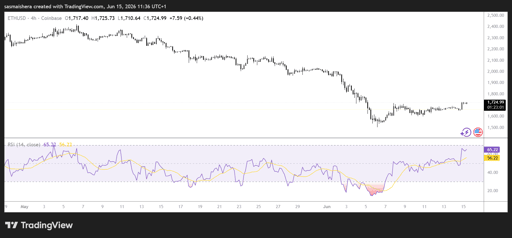
A breakdown below $1,668 could trigger renewed selling pressure and shift sentiment back toward bearish dominance.
While Ethereum’s short-term technical structure shows signs of resilience, broader macroeconomic uncertainty and regulatory pressure continue to cap upside conviction.
The market remains in a wait-and-see phase, with traders closely watching both technical breakouts and global economic developments for direction.

Injective price forecast: Coinbase integration strengthens bullish case for INJ

Bitcoin price outlook: treasury sell-offs, Poolin bankruptcy and $1.2B options expiry

How high can BEAT go as whale withdrawals drain exchange supply?

ONDO price jumps 10%: did FINRA just unlock its biggest US opportunity?

TRX tests $0.33 resistance: is Tron's gasless payment boom enough?
No results found
Loading articles...
Failed to load articles. Please try again.