Solana bulls eye $85 as ETF inflows snap last week’s outflow streak

AI Sentiment: 68/100 Bullish
This score is generated through AI-driven analysis of the article's content.
powered by
Buy Solana (SOL) for a push from ~$75 toward $85. The news shows spot Solana ETF inflows ($2.81M net on Monday) reversing last week’s outflows, plus whale accumulation and improving momentum (MACD positive, bearish momentum easing). Technicals: reclaim/hold above $77.6–$78.1 (near resistance and 50-day EMA) to unlock $85.11.
Key Risk: ETF inflows stall or flip back to outflows, and SOL fails to break/hold above ~$78, turning the bounce back into a downtrend.
Sell SOL (or short via SOL perpetuals) if price rejects the $77.6–$78.1 zone. The RSI is near overbought (~72) while the broader structure is still bearish; a rejection would likely trigger a quick unwind of the rebound and a move back toward support. Use this as a momentum-failure trade tied directly to the resistance map.
Key Risk: SOL breaks out decisively above the $78.1 area and holds, forcing shorts to cover and invalidating the rejection thesis.
- Spot Solana ETFs recorded net inflows of $2.81 million on Monday.
- Solana's long-to-short ratio for SOL stood at 1.02.
- SOL could extend its rally towards the $85 resistance level in the near term.
Solana SOL is trading around $75 on Tuesday after posting three consecutive green candles since the weekend, signaling a strong recovery phase following recent weakness.
The rebound is being supported by renewed institutional interest, with spot Solana exchange-traded funds (ETFs) recording net inflows of US$2.8 million (approx. $3.9 million) on Monday.
On the technical side, easing bearish momentum indicators suggest SOL may have room to extend its short-term rebound.
ETF inflows signal early institutional rebound
Institutional demand for Solana began the week on a positive note.
According to CoinGlass data, spot Solana ETFs recorded US$2.8 million (approx. $3.9 million) in net inflows on Monday, reversing the previous week’s $2.58 million US$2.6 million (approx. $3.6 million) in outflows.
The shift marks an early sign that institutional appetite may be returning.
If inflows continue to build through the week, analysts suggest SOL could see additional upside momentum in the near term.
Broader market data presents a more nuanced picture. CryptoQuant’s aggregated metrics indicate that Solana’s spot and futures markets are showing signs of whale accumulation alongside cooling volatility.
This suggests improving conditions for a potential recovery. The derivatives data also show signs of improving momentum.
The long-to-short ratio for SOL stood at 1.02 on Tuesday, indicating slightly more traders are betting on upside movement than downside.
However, funding rates remain negative at -0.001%, suggesting short sellers are still paying longs and reflecting persistent bearish sentiment in derivatives markets.
Solana technical outlook: Recovery faces strong overhead resistance
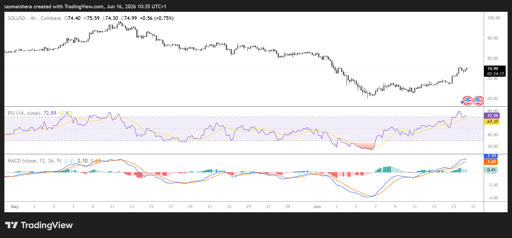
The SOL/USD 4-hour is bullish as Solana is currently trading at $74.89 after gaining more than 5% in the last 24 hours.
Despite the rebound, the broader structure remains tilted bearish as price continues to trade below major moving averages.
While the broader trend remains constrained, momentum signals are beginning to stabilize.
The Relative Strength Index (RSI) is hovering near 72, approaching the overbought region.
Meanwhile, Moving Average Convergence Divergence (MACD) has turned positive, suggesting the recent bounce may have some short-term continuation potential.
However, analysts note that this still represents a corrective move within a broader downtrend structure rather than a confirmed reversal.
If the market recovery continues, immediate resistance would be encountered at $77.57, followed closely by the 50-day EMA at $78.13.
A decisive breakout above this zone would be required to ease near-term bearish pressure and open the path toward $85.11 and higher resistance levels.
Beyond that, stronger supply zones are seen near $97.89 and the 200-day EMA at $101.67, which could serve as the medium-term targets.
However, if the bears regain control, key support remains at $60.13.
A break below this level would likely invalidate the ongoing recovery attempt and expose further downside risk.
Overall, Solana’s short-term outlook is cautiously improving, but sustained upside will depend on continued ETF inflows and a decisive break above major resistance levels.

PENGU price struggles after comic debut: why are traders selling?

Is XRP price at risk as Senate delays CLARITY Act vote?

CSPR price climbs 5%: can Casper extend its recovery?

Europe's 2026 digital identity deadline opens a $47 billion market

Will SHIB price crash as whales sell?
No results found
Loading articles...
Failed to load articles. Please try again.