
Bitcoin slips below $64000: are long liquidations ending the rebound?

AI Sentiment: 28/100 Bearish
This score is generated through AI-driven analysis of the article's content.

powered by

Buy BTC (spot) targeting a reclaim of $64,500 then $66,000. Rationale: price is sitting on the $63,200–$63,300 high-volume node with the biggest nearby liquidation cluster; long liquidations already flushed leverage, while spot buying hit the strongest cash support in days. If buyers regain control, the remaining liquidity above ($64,500–$66,000) can fuel a squeeze.
Key Risk: Fed minutes turn hawkish and trigger another wave of long liquidations that breaks $63,200 support.
Sell BTC perpetual futures (e.g., BTCUSDT perp) with a tight risk line, targeting a retest of $63,200 after rejection at $64,500. Rationale: the rally failed to hold above $64,000, RSI cooled (~56), and there’s a large liquidation pool overhead ($64,500–$66,000) that can attract short-term pops—then roll over as leveraged longs get forced out again.
Key Risk: BTC reclaims and holds above $64,500, triggering a sustained squeeze higher through $66,000.
- Bitcoin has fallen below $64,000 following a wave of long liquidations.
- The $63.2K zone is now the key test for Bitcoin’s short-term direction.
- Technical signals remain mixed ahead of Fed minutes.
Bitcoin has slipped back below $64,000 after Monday’s rebound stalled near $64,500, as long liquidations and pre-Fed caution added pressure.
According to market data from CoinGecko, Bitcoin climbed back above $64,000 after recovering from Monday's selloff but failed to extend gains beyond roughly $64,529 before retreating toward the $63,200 area, where another wave of long liquidations accelerated the decline.
Earlier in the week, Bitcoin had dropped from nearly $64,000 to around $62,000 after an SEC filing showed that Strategy sold 3,588 BTC worth about US$216 million (approx. $301.1 million) to fund dividend payments.
The filing also disclosed that the company still has authorisation to sell another US$1.3 billion (approx. $1.7 billion) of Bitcoin, leaving traders cautious about additional supply entering the market.
Later in the session, Bitcoin recovered as futures demand returned.
Data from Hyblock showed net futures buying rising to around US$568 million (approx. $791.8 million), while spot buying reached about US$143 million (approx. $199.3 million), the strongest cash-market support seen in several days.
However, Tuesday's attempt to build on that recovery has failed to attract fresh momentum.
According to Coinglass data, US$14 million (approx. $19.6 million) of Bitcoin positions were liquidated over the past four hours, with long positions accounting for US$13.6 million (approx. $19 million) of that total.
In the one hour window, US$1.3 million (approx. $1.8 million) has been liquidated, almost entirely from longs at about US$1.3 million (approx. $1.8 million).
That suggests the rally did not fail only because buyers lost interest.
Once Bitcoin started slipping from the high, the crowded long side came under pressure, and forced selling added speed to the decline.
At the same time, traders appear to be taking a defensive stance ahead of the Federal Reserve’s June meeting minutes on Wednesday.
Bitcoin price analysis
As of press time, technical indicators suggest Bitcoin has reached an important decision point after failing to establish itself above $64,000.
On the 4-hour chart, Bitcoin was rejected near the $64,500 region before falling back toward $63,200, which coincides with a major high-volume node on the Volume Profile.
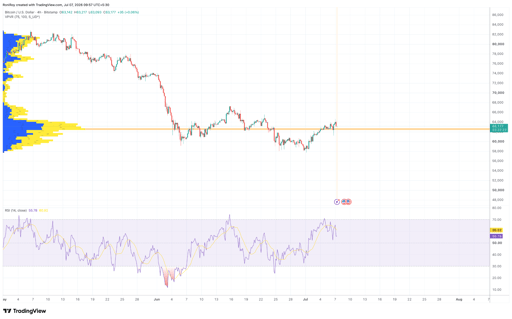
BTC/USD 4-hour price chart. Source: TradingView.
The concentration of historical trading activity around this level suggests it has become an important area where buyers and sellers continue competing for control.
On the BTC/USDT liquidation heatmap, one of the largest nearby liquidity clusters sits around $63,200 to $63,300. See below.
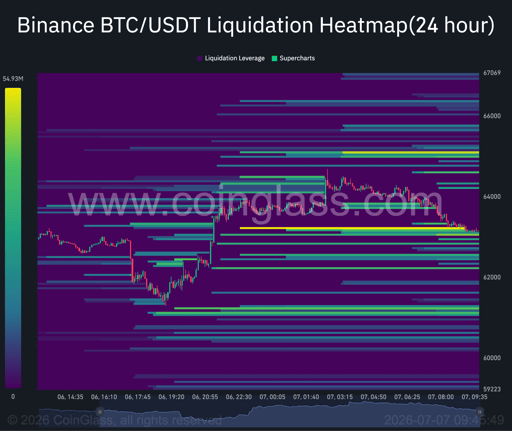
Bitcoin 24-hour liquidation heatmap. Source: Coinglass.
Price has now retraced into that zone after the latest rejection, while sizeable liquidation pools remain above the market between roughly $64,500 and $66,000, leaving room for another move higher if buyers regain control.
The failed push above $64,000 has also taken some heat out of the move.
On the 4-hour chart, RSI has slipped to around 56 after nearing overbought levels, showing that bullish pressure has cooled without turning into a full loss of momentum.
On the daily chart, Bitcoin has reclaimed its 20-day exponential moving average near $62,600 but continues trading below the 50-day EMA around $65,600, while the 100-day and 200-day EMAs remain considerably higher near $69,000 and $75,400.
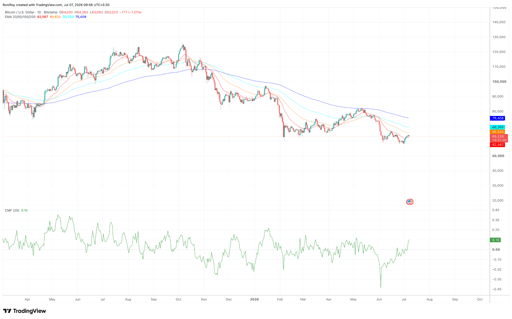
BTC/USD 1-day price chart. Source: TradingView.
This suggests the recent recovery has improved the short-term outlook but has yet to confirm a change in the medium-term trend.
While Bitcoin is still struggling to clear its higher moving averages, the daily chart is not entirely weak.
Chaikin Money Flow has moved back near 0.10, showing that buying pressure has started to improve after weeks of softer accumulation.
However, the inability to hold above $64,000 also indicates buying demand has not yet been strong enough to overcome nearby resistance.
Attention now turns to Wednesday's release of the Federal Reserve's June meeting minutes.
According to CME FedWatch data, markets currently assign a 75.6% probability that interest rates will remain unchanged at 3.50% to 3.75% this month.
Any unexpectedly hawkish signals could place additional pressure on the crowded leveraged long positions.

Why is Bitcoin price struggling around $80,000?

Zcash price breaks above $1,000 as institutional and privacy demand rise

Is XRP quietly building toward $1.90 as macro pressure eases and demand holds?

Bitcoin price defends $80,000 as bulls prepare another run at $82,000

Strategy, Coinbase stocks rally as Bitcoin reclaims $80,000
No results found
Loading articles...
Failed to load articles. Please try again.