
SCHD just hit a crucial milestone: is it a good dividend ETF to buy?

AI Sentiment: 72/100 Bullish
This score is generated through AI-driven analysis of the article's content.

powered by

Buy SCHD. It’s gathering massive inflows ($14.7B this year) while outperforming SPX/Nasdaq, and the chart setup (above 25-day EMA, RSI >50, cup-and-handle in the handle) points to continuation. The “AI-avoidance” factor is real: SCHD is heavy in healthcare, staples, and industrials, so it benefits from rotation away from semis/hyperscalers. Thesis: flows + technical continuation keep bid under dividend/value stocks.
Key Risk: Dividend ETFs keep underperforming as rates fall and investors rotate back into growth/AI leaders, crushing relative performance.
Sell JEPI and JEPQ. The article notes their total returns are <10% this year despite high distributions, and covered-call upside is capped in bull markets—exactly when SCHD is showing momentum. Thesis: investors chasing “income” will rotate from capped covered-call ETFs into dividend growth/value ETFs with better upside participation.
Key Risk: Markets turn choppy and covered calls start outperforming because equity volatility spikes and capped upside becomes an advantage.
- The SCHD ETF has hit a $100 billion assets milestone.
- This happened as its stock and inflows jumped.
- It has formed a cup-and-handle pattern, pointing to more gains.
The Schwab US Dividend Equity ETF SCHD has reached a major milestone this year, driven by robust investor inflows and solid market performance. The fund recently surpassed $100 billion in assets under management (AUM), making it the second-largest dividend ETF behind the Vanguard Dividend Appreciation ETF (VIG). With SCHD hitting this landmark, is it still a good investment at current levels?
SCHD ETF inflows are rising as it beats key benchmarks
The Schwab US Dividend Equity ETF has done well this year and is beating the top benchmark assets like the S&P 500 and Nasdaq 100 indices. SCHD’s total return since January stands at 21%, much higher than S&P 500’s 9.4% and Nasdaq 100’s 13.8%. This outperformance happened even though the fund has minimal stakes in the technology sector.
The ongoing outperformance has led to a surge in assets in the network. ETF Db data shows that its net inflows jumped by $14.7 billion this year. Its inflows have soared by over $31 billion in the last three years.
SCHD and other dividend funds are normally seen as being anti-artificial intelligence funds because they have minimal stakes in semiconductors and hyperscalers.
Instead, the fund holds many companies in traditional companies. Its biggest holdings are firms like Abbott Laboratories, UnitedHealth Group, Merck Group, Home Depot, Amgen, P&G, and Coca-Cola. Other top names in the fund are PepsiCo, Texas Instruments, and Verizon Communications.
Is SCHD a good investment?
SCHD is widely seen as a dividend ETF. Indeed, it tracks the Dow Jones US 100 Index, which measures the performance of high dividend-yielding stocks in the US. It specifically looks at companies that have grown their payouts for over 10 years.
However, in reality, the fund’s dividend payouts to investors is not all that good. It has a dividend yield of 3.2%, lower than many traditional assets. For example, the ten-year US Treasury bonds are paying a 4.60% return. Even shorter-term yields have remained above 4%.
Also, some other ETFs are paying a higher dividend than SCHD. For example, JEPI and JEPQ, which use a covered call strategy, are paying a 8.1% and 10.7%, respectively. The SPYI ETF has a dividend yield of 11.87%.
Still, JEPI has some benefits compared to these assets. For example, it is a better asset than short-term government bonds because of its capital appreciation. Also, it is a better asset than covered call ETFs because their gains are usually capped, especially in bull markets. For example, SPYI, JEPI, and JEPQ have had a total return of less than 10% this year.
SCHD ETF chart points to more gains
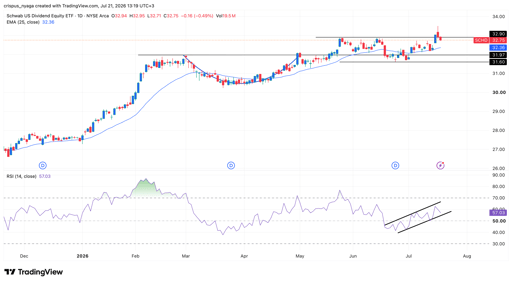
Schwab US Dividend Equity ETF | Source: TradingView
Technicals suggests that the SCHD ETF may be on the cusp of more gains in the near term. It has remained above the 25-day Exponential Moving Average (EMA).
The Relative Strength Index (RSI) has formed an ascending channel. It has already moved above the neutral line of 50.
Most importantly, the fund has formed a cup-and-handle pattern, a common bullish continuation sign. It is now in the handle section. Therefore, the most likely scenario is that the ETF continues rising in the coming months. If this happens, it may jump to as high as $50 as investors rotate from semiconductor names to value names.

Broadcom stock falls to a key support: is it about to surge after earnings?

Can AI manage your portfolio? InvestorAI's Bruce Keith answers on 'Zero Sum'

Meta stock looks undervalued: settlement and AI could unlock up to 40% upside

Micron, SanDisk stocks slip premarket as a new China risk emerges

Dow futures plunge 315 points: 5 things to know before Wall Street opens
No results found
Loading articles...
Failed to load articles. Please try again.