
Why is Injective price going up?

AI Sentiment: 72/100 Bullish
This score is generated through AI-driven analysis of the article's content.

powered by

Buy Injective (INJ) now: POSCO International + LG CNS are moving real invoice/receivable claims onto Injective’s live chain, which should lift sustained network usage (fees) and credibility for enterprise finance. The IIP-677 upgrade also expands cross-chain routing and improves execution/settlement—tailwind for DeFi builders and liquidity. Supply is tightening via the August community buyback/burn (33,000+ INJ). Thesis killer: enterprise pilot stalls or fails to generate ongoing on-chain throughput/fees, and the buyback demand can’t offset selling pressure—INJ breaks back below ~$4.65 and loses the rebound.
Key Risk: The POSCO/LG CNS pilot doesn’t turn into real, repeat usage—fees stay weak and INJ supply/buyback can’t overcome sell pressure.
Buy INJ call exposure (e.g., 1–3 month INJ calls) targeting a break above the 20/50-day EMA resistance cluster near ~$4.93–$4.97, then $5.09 and $5.49. The chart is already testing the 100-day EMA (~$4.79) with improving momentum; a daily close through the EMA cluster is the trigger for a trend continuation move. Thesis killer: price rejects the EMA cluster and momentum rolls over—INJ falls below ~$4.72 (4-hour midpoint) and then ~$4.59, invalidating the breakout setup.
Key Risk: INJ fails at ~$4.93–$4.97 and momentum breaks down, dropping below key supports and killing the breakout.
- Injective has climbed nearly 7% in 24 hours.
- South Korea's POSCO International and LG CNS have integrated Injective.
- INJ's 20-day and 50-day EMAs are capping gains near $4.93.
Injective price has climbed nearly 7% over the past 24 hours to around $4.80 as traders responded to an enterprise trade-finance deployment, a mainnet upgrade, and plans to remove more INJ from circulation.
CoinGecko data showed INJ rising from roughly $4.50 to $4.80 during the session, with the strongest buying arriving after the token cleared the $4.65 area.
The price remained close to its intraday high at the time of writing, while its weekly performance was still down about 6.9%.
The rally followed news that South Korean trading group POSCO International and information technology company LG CNS had selected Injective for an on-chain trade-finance pilot involving commercial invoices and accounts receivable.
Unlike trials that use test environments or sample assets, the project places claims generated by POSCO subsidiaries across its international supply chain on a live blockchain network.
Injective will provide the shared ledger used to issue, verify, and settle the trade claims while supporting compliance rules within the process.
For INJ traders, the deployment links network activity to a corporate finance use case rather than a purely crypto-native application.
POSCO International and LG CNS are using the chain to test whether invoices and receivables can move through an on-chain system with fewer separate records between participating businesses.
Injective has also deployed its IIP-677 interoperability upgrade, identified as mainnet version 1.20.3, after the proposal received governance approval.
At the protocol level, the release expands native asset routing across external blockchains, allowing applications on Injective to connect with liquidity from more networks.
It also includes changes intended to improve transaction execution, settlement, and order-book reliability when activity increases.
Developers building decentralized finance products on Injective will gain additional asset-bridging options under the upgrade.
The changes support the network’s focus on financial applications that need to move assets and liquidity between multiple chains.
Supply mechanics have added another factor behind the latest INJ price move.
Injective has opened its August Community BuyBack, through which more than 33,000 INJ is expected to be permanently removed from circulation.
Under the network’s auction model, fees collected from applications are directed into a pool that buys INJ.
Purchased tokens are then burned, while participants in the community auction receive incentives under the program’s rules.
With the full INJ supply already unlocked, the mechanism does not have to offset scheduled token releases.
Each completed auction instead reduces the circulating amount, although the size of its market impact depends on network fees, auction demand and trading liquidity.
INJ price analysis
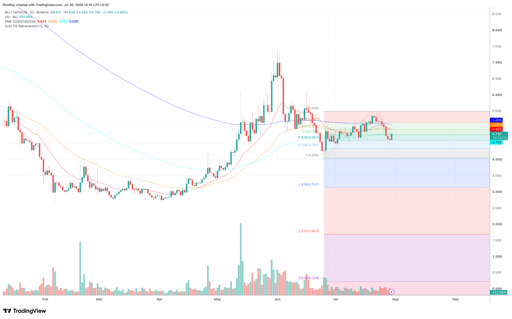
The daily INJ/USDT chart placed the token near $4.79 after it rebounded from the lower part of its recent trading range.
INJ/USDT 1-day price chart. Source: TradingView.
INJ posted a session high near $4.84 and a low around $4.58, leaving the price close to the day’s upper end.
INJ is currently testing its 100-day exponential moving average near $4.79.
The 20-day and 50-day EMAs are clustered around $4.93, creating the first major resistance zone above the market.
A daily close above the $4.93 EMA cluster would bring the upper Keltner level near $4.95 into focus, based on the accompanying four-hour chart.
The next resistance sits at the 200-day EMA around $5.09.
The Fibonacci retracement drawn from approximately $4.04 to $5.49 places INJ around the 50% retracement level near $4.76.
The 38.2% level and short-term moving averages converge around $4.93 to $4.97, making that area important for determining whether the rebound can continue.
Should buyers clear $5.09, the daily chart leaves room for a retest of the $5.49 swing high used in the Fibonacci setup.
Such a move would require INJ to break the 20-day, 50-day and 200-day EMAs rather than merely trade above them during an intraday move.
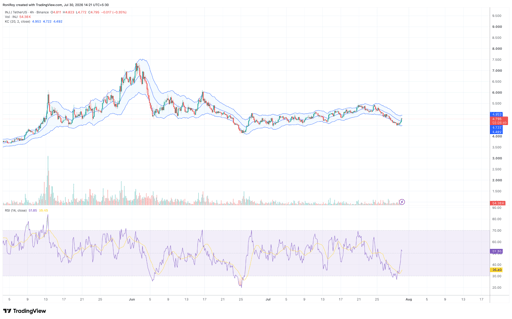
On the 4-hour chart, INJ has bounced from the lower Keltner Channel and moved back above the channel’s midpoint near $4.72.
See below:
INJ/USDT 4-hour price chart. Source: TradingView.
The upper band stands near $4.95, matching the resistance identified by the daily EMA structure.
The 4-hour relative strength index has recovered to about 52 after falling toward oversold territory during the pullback.
The reading places momentum just above the neutral 50 level, while the indicator’s average remains lower near 35.
Volume, however, remains below the spikes recorded during INJ’s May and early June advance.
The chart therefore shows improving momentum without the same level of trading participation that accompanied the earlier rally.
On a pullback, the Keltner midpoint near $4.72 provides the first short-term level to watch.
The daily Fibonacci structure places additional support around $4.59, followed by the lower Keltner band near $4.49 and the 78.6% retracement around $4.35.
A break below those levels would expose the prior swing low near $4.04, while sustained trading above $4.95 would place the $5.09 and $5.49 resistance levels back in play.

Uniswap price jumps above $4: is a bigger UNI breakout about to explode?

PI network jumps 10%: is a breakout finally taking shape?

PENGU price struggles after comic debut: why are traders selling?

Is XRP price at risk as Senate delays CLARITY Act vote?

CSPR price climbs 5%: can Casper extend its recovery?
No results found
Loading articles...
Failed to load articles. Please try again.