
The Trade Desk stock is in a freefall after earnings: classic value trap?

AI Sentiment: 12/100 Bearish
This score is generated through AI-driven analysis of the article's content.

powered by

Buy TTD only on a decisive stabilization around $10 (hold of the psychological level after the descending-triangle breakdown). The stock is already pricing severe deterioration; if the next earnings cycle shows less-bad numbers, the market can snap back quickly from oversold levels. Use the $10 area as the thesis line: if it holds, the “value trap” narrative weakens and the multiple can re-rate.
Key Risk: The $10 level fails and the downtrend accelerates into new lows, confirming the deterioration thesis.
Sell TTD. Earnings showed revenue growth collapsing (Q2 +3% vs prior double-digit era) and margins compressing (net margin 9% vs 13%), with Q3 revenue guidance ($650m) far below expectations ($804m). Valuation looks “cheap,” but that’s the trap: the business is deteriorating, so the multiple can stay low. Chart confirms momentum breakdown: below 50/100-day EMAs and a bearish descending triangle, with $10 the next magnet.
Key Risk: TTD proves guidance was a one-off and re-accelerates growth fast enough to stop further analyst downgrades.
- The Trade Desk stock has tumbled to $13 after earnings.
- The company’s revenue growth has stagnated this year.
- It has become a classic value trap as the sell-off continues.
The Trade Desk stock continued its strong freefall, reaching its lowest level since January 2019. TTD has plunged by over 90% from its all-time high, marking a sharp reversal for a company that was one of the top performers in 2024. This sell-off continued in the extended hours after publishing its earnings.
The Trade Desk earnings came short of expectations
The Trade Desk, a top player in the adtech industry, published relatively weak earnings, continuing a weakness that has been going on for a while.
Its results showed that its revenue rose by just 3% in the second quarter to $715 million. That is a tiny revenue growth for a company that was used to have double digit growth in the past few years. Its six-month revenue expanded by 7% to $1.4 billion, lower than the 22% it experienced in the same period last year.
The same issues continued in terms of profitability. Its net income margin dropped to 9% from the previous 13%, with the net profit falling to just $64 million. In a statement, the CEO said:
“We have a clear understanding of the factors that impacted our performance, and we are taking decisive action to strengthen our execution, upgrade our platform, and sharpen our focus on the areas where we can create the greatest value.”
Sadly, the slow growth is expected to slow down in the foreseeable future. The management guided to third quarter revenue to be $650 million. In contrast, the average estimate among analysts was that its revenue would come in at $804 million. It also expects the adjusted EBITDA to be about $160 million.
READ MORE: Trade Desk stock: Cramer reveals a major red flag beyond Q1 earnings
TTD is a classic value trap
The Trade Desk has now become a classic value trap, which is defined as a company that appears cheap based on traditional valuation metrics, but is actually a poor investment because its business is deteriorating.
In this case, the company has a forward price-to-earnings ratio of 10.25, lower than the sector median of 12.7. It is also significantly lower than the five-year average of 54.
While the valuation metrics look attractive, the company’s deterioration means that it may remain under pressure in the foreseeable future. This explains why the consensus target among analysts dropped to $31.50 from $98 a year earlier. More analysts will likely downgrade the company after this earnings report.
The Trade Desk stock price technical analysis
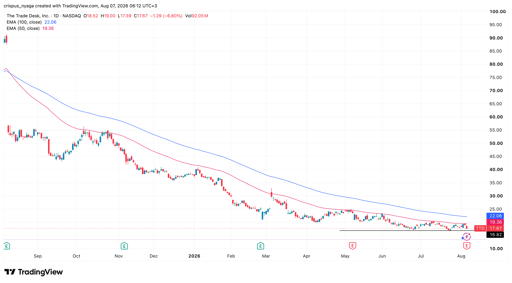
TTD stock chart | Source: TradingView
The daily chart shows that the TTD share price has crashed hard this year. It has constantly remained below the 50-day and 100-day Exponential Moving Averages (EMA).
The stock formed a descending triangle pattern whose lower side was at $17, its lowest level in June and July. This pattern is one of the most bearish continuation sign in technical analysis.
It dropped to $13 in the extended hours, confirming the downward trend. Therefore, there is a risk that it will continue falling further, potentially to the psychological level of $10.

Trump administration eyeing stake in Venezuelan oil fields? Here's what we know

Why is Autodesk stock falling 4% despite Q2 earnings beat

Apple stock rises ahead of Sept. 9 event with foldable iPhone in focus

Pentagon defeated: Anthropic poised for blockbuster IPO after landmark court win

BofA names 3 dividend stocks for stability amidst choppy markets
No results found
Loading articles...
Failed to load articles. Please try again.