
Ethereum bulls are paying up, so why is the market refusing to break higher?

AI Sentiment: 42/100 Bearish
This score is generated through AI-driven analysis of the article's content.

powered by

Buy Ethereum (ETH) only after a daily close below $1,865 (50-day EMA). The article flags that prolonged negative Net Taker Volume has historically preceded declines; if $1,865 breaks, odds rise of a move to $1,809 and then $1,701. This is a momentum confirmation entry, not a guess.
Key Risk: ETH quickly reclaims $1,865 and re-enters the range, invalidating the “seller control” continuation.
Sell Ethereum (ETH) on strength into $1,920–$1,961 (100-day EMA / nearby resistance). The tape is mixed: Net Taker Volume is slightly negative (mild seller aggression) while funding is only modestly positive, and Open Interest growth is weak—no real breakout fuel. Expect continued compression and rejection back toward the 20–50 day EMA area ($1,884 then $1,865).
Key Risk: ETH closes above $1,961 and holds, proving sellers can’t cap rallies and forcing a momentum breakout toward $2,172+.
- Ethereum buyers and sellers continue to struggle for control in recent days.
- Open Interest has slightly increased, but retail activity remains relatively weak.
- A breakout above $1,920 could target the $1,961 resistance in the near term.
Ethereum ETH derivatives activity has remained largely range-bound over the past week as traders show limited conviction following a mild shift toward seller dominance.
Net Taker Volume remains slightly negative, while Open Interest has struggled to sustain growth.
Funding rates, however, continue to favor long positions, creating a mixed picture in which sellers control immediate market-order activity but bullish expectations have not disappeared.
Ethereum’s price reflects the same uncertainty, trading within a narrow band formed by its short- and medium-term Exponential Moving Averages (EMAs).
ETH Net Taker Volume shows mild seller dominance
Ethereum’s Net Taker Volume moved slightly into negative territory at the beginning of August and has remained there.
The indicator calculates the difference between market buying and selling volume in ETH perpetual futures.
A negative reading means that sell orders are exceeding buy orders, signaling greater aggression among bearish traders.
However, the difference between buying and selling activity has remained modest during the past two weeks. This suggests that neither side has established decisive control over the market.
Historically, prolonged periods of negative ETH Net Taker Volume have accompanied price declines, including the downturns recorded in January and May.
A deeper move into negative territory could therefore increase downside pressure.
Ethereum Open Interest showed limited movement over the past week, indicating that substantial new capital has remained on the sidelines.
Open Interest has slightly increased to $25.94 billion on Monday. Up from the $24 billion recorded the previous day.
The increase suggests that traders opened new positions, but the broader trend still reflects weak participation compared with previous periods.
Open Interest represents the total value of outstanding derivatives contracts.
A sustained increase typically points to greater trader involvement, while a decline suggests that market participants are closing positions or reducing exposure.
Furthermore, Ethereum’s funding rate remained positive at approximately 0.0049% on Monday.
Positive funding means traders holding long positions are paying those holding short positions, indicating that bullish positions retain a slight advantage in the perpetual futures market.
The combination of weak Open Interest earlier in the week and positive funding rates suggests that overall participation remains limited even though the traders who remain active show a modest preference for further price gains.
Taken together, the derivatives indicators present a mixed outlook.
Net Taker Volume reflects mild short-side dominance in immediate trading, while funding rates reveal a slight long bias. Open Interest, meanwhile, points to a general lack of conviction.
Ethereum remains trapped between key moving averages
On the daily chart, Ethereum maintains a neutral short-term outlook as it trades around its 20-day EMA at $1,884.
The 100-day EMA at approximately $1,920 continues to limit the upside, leaving ETH compressed within a narrow band of technical support and resistance.
The Relative Strength Index stands at 49, while the Stochastic indicator is near 50. Both readings reflect balanced momentum and provide little evidence of an imminent bullish or bearish move.
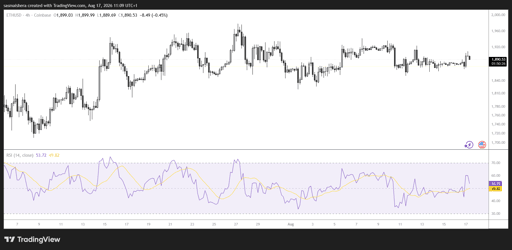
A sustained break above the 100-day EMA at $1,920 could allow Ethereum to challenge the horizontal resistance level at $1,961. Further gains could bring the higher resistance zones at $2,172 and $2,431 into focus.
On the downside, the 50-day EMA at $1,865 provides initial support. A daily close below this level could extend the decline toward $1,809.
If sellers regain firm control, the more substantial support levels at $1,701 and $1,507 could become relevant.

Crypto price predictions: Dogecoin, XRP, Venice Token (VVV)

Zcash price prediction: Here’s why ZEC token has gone parabolic

ARB price prediction: How Robinhood Chain growth is boosting Arbitrum

Why is Bitcoin price struggling around $80,000?

Zcash price breaks above $1,000 as institutional and privacy demand rise
No results found
Loading articles...
Failed to load articles. Please try again.