
Why is PUMP price going up today?

AI Sentiment: 78/100 Bullish
This score is generated through AI-driven analysis of the article's content.

powered by

Buy PUMP. Revenue is accelerating (highest weekly protocol revenue since Feb) and 50% of that revenue is used for PUMP buyback-and-burn, tightening supply (28.6% of circulating supply already bought/burned). The token is also breaking out: price is above key EMAs and testing the Donchian resistance near $0.00313; a daily close above it targets $0.00330 then $0.00350. Key risk: PUMP fails to clear $0.00313 and momentum reverses, turning buyback support into a lagging signal while traders dump the token back into the $0.00282–$0.00255 range.
Key Risk: A breakout failure: PUMP rejects $0.00313 and momentum flips, dragging price back below the $0.00282–$0.00255 support zone.
Sell PUMP on any daily close back below the 20-day EMA (~$0.00259) after the breakout attempt. The thesis is that the rally is being driven by real platform activity (fees up, buybacks active). If price loses the 20-day trend line, it signals that revenue-driven demand isn’t translating into sustained buying, and the next support ($0.00255, then $0.00221/$0.00203 golden-cross area) becomes a magnet. Key risk: price holds above ~$0.00259 and reclaims $0.00313, proving the breakout is real and making the “trend failure” exit wrong.
Key Risk: Price holds the uptrend (reclaims $0.00313 and stays above ~$0.00259), invalidating the trend-failure sell trigger.
- PUMP is up more than 8% in 24 hours after recently hitting a 6-month high.
- Pump.fun revenue reached a seven-month high.
- PUMP has formed its first daily golden cross since launch.
Pump.fun’s PUMP token has risen more than 8% over the past 24 hours to around $0.00301, extending its seven-day gain to more than 10% after recently reaching a six-month high.
CoinGecko data shows PUMP traded as high as roughly $0.00312 during the latest session, while its market capitalisation stood near $1.18 billion and 24-hour trading volume reached roughly $93 million.
The token was also ranked second among the trending cryptocurrencies displayed on CoinGecko’s PUMP page.
The latest price rally has followed a strong month for PUMP, which has gained more than 50% over the past 30 days.
The price has recovered sharply from its July low near $0.00149 and has now doubled from that level.
Pump.fun’s improving revenue figures provide one of the main reasons behind the move.
According to market data from DefiLlama, the platform generated roughly $11.52 million in protocol revenue over the past seven days, its highest weekly total since February, making Pump.fun fourth among crypto protocols by seven-day revenue ahead of Hyperliquid and Polymarket.
For Aug. 10 to Aug. 16, Pump.fun recorded $10.74 million in fees, up 7% from the previous week.
Its strongest single day produced roughly $1.73 million, the highest daily figure since Jan. 30.
Higher protocol revenue also feeds directly into demand for PUMP because of the project’s token buyback programme.
Pump.fun directs 50% of protocol revenue through a smart contract to buy back and burn PUMP tokens.
According to figures reported by the project’s ecosystem account, roughly $5.52 million worth of PUMP was bought and burned during the latest seven-day period.
Cumulative purchases and burns have reached approximately $429.6 million, equivalent to 28.58% of the token’s circulating supply.
Trading activity has received another push from changes introduced on the Pump.fun platform.
On Aug. 13, the project launched Callout Rewards, a programme that pays users based on the trading volume generated by their token calls.
Pump.fun subsequently reduced trading fees on its app to 0% for Solana trades and 0.1% for cross-chain trades, giving users another incentive to trade through the platform.
Price momentum has strengthened alongside those developments, with PUMP recently reaching a six-month high and breaking above levels that had capped previous recovery attempts.
PUMP price analysis
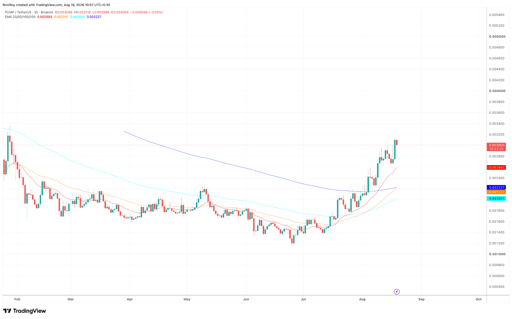
PUMP’s daily chart has produced its first golden cross since the token launched, after the 50-day exponential moving average crossed above the 200-day EMA.
See below:
PUMP/USDT 1-day price chart. Source: TradingView.
The chart puts the 50-day EMA near $0.00221 and the 200-day EMA around $0.00203, while PUMP trades close to $0.003.
Price is also above the 20-day EMA near $0.00259, leaving all three averages below the current market price.
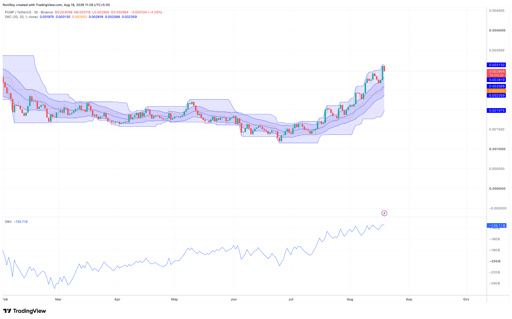
Momentum on the separate daily chart remains strong, although PUMP is now testing an important resistance area. See below.
PUMP/USDT 1-day price chart. Source: TradingView.
The upper Donchian Channel sits near $0.00313, almost matching the latest intraday high around $0.00312.
A daily close above $0.00313 would therefore confirm a breakout from the current channel and could put the February price region around $0.00330 in play, followed by $0.00350 if buyers maintain control.
On-balance volume has climbed steadily alongside the rally and currently sits near -135.11 billion, its strongest reading on the displayed chart since February.
The rising OBV trend shows that volume has moved in the same direction as price during the recovery from the July bottom rather than weakening as PUMP approached $0.003.
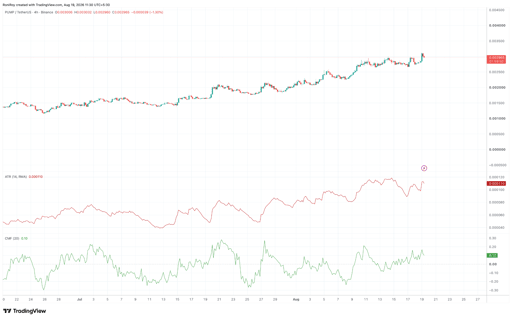
The 4-hour chart provides a similar picture but also shows that volatility has increased.
PUMP/USDT 4-hour price chart. Source: TradingView.
The 14-period average true range stands near $0.000110, up substantially from readings around $0.00004-$0.00006 seen during quieter periods in July.
Elevated ATR means larger price swings remain possible in either direction while PUMP tests the $0.0030-$0.00313 region.
At the same time, the 4-hour Chaikin Money Flow remains positive at approximately 0.10.
A reading above zero shows that buying pressure has outweighed selling pressure over the indicator’s measurement period, supporting the latest move despite PUMP pulling back from its intraday high.
Failure to clear $0.00313 could instead keep the token inside its current range.
The daily Donchian setup places initial support around $0.00282, while the 20-day EMA near $0.00259 and the Donchian area around $0.00255 form the next support zone.
A deeper correction would bring the golden-cross region back into focus, with the 50-day and 200-day EMAs providing lower reference levels around $0.00221 and $0.00203.

Hyperliquid fails at $60: are whale shorts about to push HYPE sharply lower?

Pi Network forms a risky pattern despite some major upgrades

Dogecoin looks weak below $0.07, yet one signal hints the selloff is fading

Can XLM hold $0.14 as bearish traders tighten their grip on Stellar?

Why is XRP falling below $1 even as Ripple expands its banking footprint?
No results found
Loading articles...
Failed to load articles. Please try again.