
Nikkei 225 Index analysis as Japan bond yields surge, Softbank stock plunges

AI Sentiment: 12/100 Bearish
This score is generated through AI-driven analysis of the article's content.

powered by

Sell Nikkei 225 exposure (e.g., iShares Nikkei 225 ETF (EWJ) or Nikkei 225 futures). Setup: 10Y Japan yield ~3% and 30Y ~4.17% are repricing discount rates; BoJ hike odds ~91% and stocks historically underperform into hikes. Technicals confirm momentum: below 50-day MA, bearish PPO crossover, down-gap—market is already trading the next leg lower toward 60,000 support.
Key Risk: BoJ signals a slower/softer path (or yields fall fast), reversing the rate-driven de-rating and breaking the bearish technical trend.
Sell SoftBank Group (9984.T) outright. Setup: it’s a high-duration, rate-sensitive “AI proxy” and already down ~46% YTD; with yields surging and risk-off from US–Iran escalation lifting oil/inflation, funding costs and equity risk premia stay hostile. If Nikkei keeps sliding, SoftBank typically amplifies downside versus the index.
Key Risk: A sharp risk-on reversal (yields drop and geopolitical stress eases) plus a catalyst that re-rates SoftBank’s growth/AI cash-flow expectations.
- Nikkei 225 Index dropped as Japan bond yields continued rising.
- It also dropped as the US and Iran restarted their kinetic action.
- Traders are betting that the BoJ will hike interest rates this month.
The Nikkei 225 Index continued its strong downward spiral, reaching its lowest level since August 5 this year, and 11.80% from its highest point this year. This retreat happened as the US-Iran tensions and Japan’s bond yields continued the bull run. It slipped to 64,253 points, with most Japanese companies being in the red.
Nikkei 225 Index as Japan bond yields jump
The Nikkei 225 Index dropped, mirroring the performance of other global indices as the rout in Japanese bonds continued. Data shows that the ten-year jumped to 3%, its highest level in decades. Similarly, the 30-year yield soared to 4.17%, much higher than the pandemic low of 0.113%.
Japanese bond yields have continued rising as concerns about the economy and the government spending, which has remained at an elevated level. Under Sanae Takaichi, spending and budget deficits have continued widening.
The Japanese yen has also retreated sharply this week. Data shows that the USD/JPY pair crossed the important milestone of 160, continuing an uptrend that started on August 3rd when it bottomed at 155.22 following Trump’s intervention.
The Nikkei 225 Index has also dropped as traders predicted that the Bank of Japan (BoJ) will hike interest rates later this month. Odds that this will happen have jumped to 91% on Polymarket and Kalshi. Stocks tend to underperform whenever the bank is hiking rates.
Stocks also dropped after the US and Iran restarted their war. The US launched attacks on Tuesday as it retaliated against Iran’s attacks in Jordan, which happened after the US hit key sites near the Strait of Hormuz. These attacks have pushed crude oil prices higher, with Brent and the WTI moving to $95 and $90, respectively.
Japan is highly exposed to the crisis in the Middle East, where it imports substantial amounts of oil. It also means that Japan’s inflation will continue rising in the near term.
Most Japanese companies were in the red today. Softbank Group, which has become a proxy for the AI space, dropped by 6.16% and has now dropped by 46% from its highest point this year. Kioxia has also dropped to 51,170 yen, down by 54% from the year-to-date high.
Other top laggards were companies like Toyota Motor, Tokyo Electron, Recruit Holdings, and Hitachi.
Nikkei 225 Index technical analysis
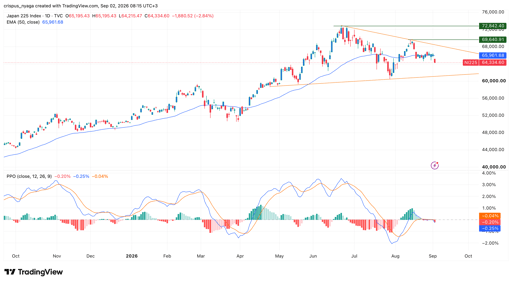
NI225 Index chart | Source: TradingView
The daily chart shows that the Nikkei 225 Index has slumped sharply from the year-to-date high of 72,842 in June to the current 64,266. It formed a down-gap as the Japanese bond yields continued rising.
The index has slumped below the 50-day moving average, a sign that bears are in control for now. Also, the two lines of the Percentage Price Oscillator (PPO) have formed a bearish crossover pattern.
Therefore, the index will continue falling, potentially to the key support level of 60,000.

KOSPI tumbles despite chip buybacks: how much support can they really provide?

Cathie Wood buys $31.6M of Rocket Lab stock: is she betting the selloff went too far?

Samsung, SK Hynix stocks sink 3% as a new risk hits the AI memory trade

Dow falls 400 pts as oil prices surge and Fed rate hike bets rise

Evening digest: US's Iran strikes lift oil, Apple welcomes new CEO
No results found
Loading articles...
Failed to load articles. Please try again.