
Hang Seng Index forms a highly bullish pattern as China trade surplus jumps

AI Sentiment: 78/100 Bullish
This score is generated through AI-driven analysis of the article's content.

powered by

Buy Hang Seng exposure (e.g., iShares Hang Seng Index ETF, 2800.HK). China’s August trade surplus jumped to $119B and exports/imports both surged, plus the $54B stimulus for state banks/insurers should support credit and funding for HSI constituents. The chart is set up for a bullish breakout: bullish flag + falling wedge, consolidating near the 50/100-day EMAs with 26,000 as the next magnet.
Key Risk: Oil-driven margin pressure and risk-off selling overwhelms the China-positive data, pushing HSI back below the consolidation range.
Buy CMOC Group (CMOC, 3993.HK). The article flags strength in industrial inputs (molybdenum/tungsten) as demand holds steady, and the broader China trade rebound supports metals/industrial activity. If HSI breaks higher, CMOC should benefit from both macro momentum and relative strength in materials.
Key Risk: A sharp slowdown in industrial demand or a commodity price reversal hits molybdenum/tungsten pricing, wiping out the demand-support thesis.
- The Hang Seng Index remained inside a narrow range this week.
- China’s trade surplus continued to grow in August this year.
- The index has formed a bullish flag pattern, pointing to more gains.
The Hang Seng Index retreated a bit on Tuesday, even after macro data showed that China’s trade surplus rebounded in August. It retreated to 25,345, down by 3.3% from its highest point in August. On the positive side, it has formed a bullish pattern that may suggest more upside in the near term.
China’s trade surplus surged in August
China released a highly encouraging report, which showed that the economy was doing well. This report revealed that its exports jumpd by 25% in August after growing by 23.9% in the previous month.
Imports jumped by 28.3% after growing by 27% in July. As a result, the trade surplus soared to $119 billion in August, higher than the median estimate of $118.6 billion and the previous month’s $112.5 billion. The surplus through August jumped to over $809 billion.
These numbers came a day after China announced that it will offer a $54 billion stimulus for state banks and insurance companies. That stimulus would help many companies in the Hang Seng Index.
The Hang Seng Index fell as concerns about the energy markets continued. Brent, the global benchmark, rose to $98, while the West Texas Intermediate (WTI) moved to $93. These benchmarks have risen to their highest level since July. They have soared by 40% from its lowest level in July.
Oil has jumped as tensions between the United States and Iran continue. Iran has said that it will launch a new Strait exclusion zone focusing on ships that attempt to cross the strait. These ships will be placed in new Iranian sanctions. Higher oil prices will affect Chinese companies, including those in the Hang Seng Index.
Most companies in the index were little changed today. CMOC Group, a leading molybdenum and tungsten producer, jumped by 6.23% as demand for the products remained steady. Longfor Group rose by 4.16%, while Sino Biopharmaceutical, China Petroleum & Chemical, and Alumunium Corporation were up by over 4%.
On the other hand, top technology companies like Lenovo Group, BYD Electronic, and Xiaomi were among the top laggards in the index. Lenovo dropped by over 5% on Tuesday, but remains up sharply from its lowest level this year.
Hang Seng technical analysis
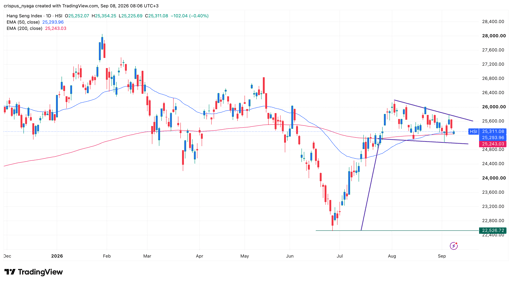
Hang Seng Index chart | Source: TradingView
The daily chart shows that the Hang Seng Index has rebounded from a low of 22,526 in June to the current 25,345. It is consolidating at the 50-day and 100-day Exponential Moving Averages (EMA).
On the positive side, the index is forming a bullish flag pattern, a common continuation sign in technical analysis. It has also formed a falling wedge pattern, which often leads to a strong comeback.
Therefore, the index will likely have a strong bullish breakout in the near term. If this happens, the next key level to watch will be the psychological level of 26,000.

Samsung, SK Hynix send KOSPI above 7,100 as Nikkei buckles under yen pressure

Michael Burry calls Lululemon his portfolio trickster: why he is buying the crash
Nvidia supplier Wistron is spending big on AI: why is the stock falling?

Why investors see more upside for SanDisk's 500% rally

USD/JPY signal: forecast as a death cross forms ahead of key US, Japan macro data
No results found
Loading articles...
Failed to load articles. Please try again.