
Can BitMine’s ETH buying push Ethereum price toward $2,600?

AI Sentiment: 68/100 Bullish
This score is generated through AI-driven analysis of the article's content.

powered by

BitMine is adding ~28k ETH weekly and already holds ~4.9% of circulating supply, with much of it staked—real, persistent buy pressure. ETH is back above $2,500 and still shows positive Chaikin Money Flow plus strong short-term trend (Aroon Up ~93%). Play the breakout attempt: buy ETH spot or the largest ETH spot ETF on dips toward $2,480, targeting a push through $2,520 toward $2,550–$2,564.
Key Risk: A clean rejection at $2,520 that flips momentum negative and drags ETH below $2,450, overwhelming the corporate bid.
Consolidation has crushed swings (ATR down sharply), while flows are mixed but not collapsing and BitMine’s steady buying should dampen downside. Sell near-term volatility on ETH (e.g., short an at-the-money straddle or sell a put spread) with the thesis that ETH chops between ~$2,450–$2,520 until a breakout.
Key Risk: A volatility expansion breakout—ETH clears $2,520 and accelerates toward $2,564+ (or dumps hard below $2,450), making the short-vol position lose quickly.
- Ethereum price is up near $2,513 after several days of consolidation.
- BitMine bought another 28,086 ETH, taking its holdings to 5.929 million ETH.
- A break above $2,520 could put the $2,550 to $2,564 resistance zone in focus.
Ethereum has risen 1.8% over the past 24 hours to around $2,513, as fresh buying from BitMine and another attempt at the $2,520 resistance area have supported the move.
CoinGecko data puts ETH up 5.5% over the past seven days and 31.7% over the past month, with the token recovering from an intraday low near $2,450 before moving back above $2,500 on Sept. 9.
BitMine disclosed on Sept. 8 that it had bought another 28,086 ETH during the previous week, taking its holdings to 5.929 million ETH.
The position represents close to 4.9% of Ethereum’s circulating supply, while 5.07 million ETH held by the company has already been staked.
The purchase continued a run of weekly ETH buying since BitMine launched its treasury strategy in June 2025, putting fresh corporate demand into the market just before Ethereum’s latest move.
Price action has now brought ETH back towards the upper end of a range that has contained the token for several sessions.
Ethereum absorbed heavy selling during consolidation
Ethereum’s sideways move over the past few trading sessions followed a fast rise from below $2,000 in August, with profit-taking increasing as the price approached $2,500.
Selling pressure included a large wallet tracked by Lookonchain that began moving 167,855 ETH, worth roughly $408 million, to exchanges near the end of August.
The wallet initially deposited 70,739 ETH worth close to $174 million before moving the remaining balance through Sept. 4.
ETH stayed within the upper $2,400s for much of the period despite those transfers.
Spot Ethereum ETF flows became less consistent at the same time.
Farside data recorded $48.2 million in net outflows on Sept. 2, followed by $141.4 million of inflows on Sept. 3 and another $25.9 million on Sept. 4. Sept. 8 flows were effectively flat.
Macro conditions have also remained difficult for risk assets over the past week.
Brent crude has traded above $100, the US 10-year Treasury yield has been close to 4.8%, and expectations for another Federal Reserve rate increase have risen ahead of inflation data.
Reuters noted that ETH had held close to its recent highs despite the rise in Treasury yields.
ETH technicals show weak momentum below resistance
On the daily TradingView chart, ETH was trading near $2,507 after holding most of the gains from its August breakout. See below.
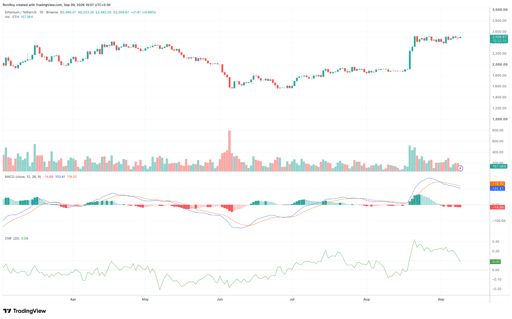
The daily MACD line stood at 103.41, below the signal line at 118.30, while the histogram had slipped to minus 14.89.
The crossover shows that momentum has lost some strength during the consolidation, leaving ETH with less support for a clean break above the $2,520 to $2,564 resistance zone.
Chaikin Money Flow, however, remained positive at 0.09 despite falling from above 0.20 after the August breakout.
Buyers are therefore still putting more money into ETH than sellers are taking out, which could help the price hold the $2,480 to $2,450 area during another pullback.
On the 4-hour chart, the Aroon Up reading stood at 92.86%, compared with Aroon Down at 57.14%, showing buyers still have the stronger hold on the short-term trend.
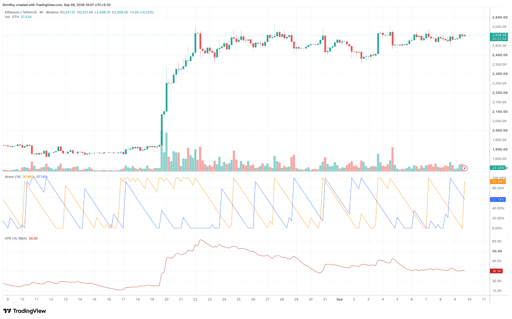
Aroon Up staying close to 100% would support another attempt at the recent highs, while a drop below Aroon Down could signal that sellers are starting to take control.
Average True Range had fallen to 30 from close to 60 during the sharp August move, showing that price swings have narrowed considerably during the consolidation.
A rise in ATR alongside a break above $2,520 could signal that volatility is returning as buyers target the $2,550 to $2,564 area.
If ETH fails to clear $2,520, the first support sits near $2,480, followed by $2,450, where buyers have stepped in several times during the past few sessions.

USELESS price risks 50% correction after 900% rally

BitMine stakes 85% of its ETH: why $330M barely changes the risk equation

XRP price is flashing a 48% upside setup, but $1.50 must break first

Bitcoin rebounds $1,500 from its intraday low: who keeps buying near $77K

Why is Hyperliquid price still rising after an $820 million token unlock?
No results found
Loading articles...
Failed to load articles. Please try again.