
XRP price prediction amid RLUSD stablecoin and ETF tailwinds

AI Sentiment: 72/100 Bullish
This score is generated through AI-driven analysis of the article's content.

powered by

Buy XRP spot. Catalysts stack: ETF inflows (Bitwise XRP + Grayscale GXRP) and RLUSD growth (RLUSD assets $2.4B; XRPL stablecoins $1.12B) are real demand signals, not just hype. Chart setup supports continuation: bullish flag forming above the 50-day and Supertrend, with a clear upside target at $1.5484 (~15%). Thesis killer: XRP breaks and holds below $1.3093 (Sept 2 low), signaling the bullish pattern failed and ETF/RLUSD tailwinds aren’t enough to stop downside.
Key Risk: XRP falls below $1.3093 and keeps sliding, proving the bullish chart setup is broken.
Buy XRPL-linked exposure by adding XRPL ecosystem tokens with meaningful stablecoin/RWA linkage (e.g., RWA issuers/holders on XRPL) rather than chasing pure beta. The news says RLUSD is driving usage: 30-day transfer volume +30% to $5.45B and holders +80.7k, plus 377 RWA assets totaling $4.06B. Second-order payoff: as RLUSD liquidity grows, more on-chain settlement and tokenization activity increases fee/usage demand across XRPL assets, lifting the whole ecosystem basket. Thesis killer: RLUSD growth stalls (stablecoin supply/usage stops rising) or regulatory/issuer issues impair XRPL tokenization flows.
Key Risk: RLUSD usage growth stops (volume/holders flatten) and XRPL tokenization activity weakens.
- XRP price remained in a narrow range in the past few days.
- Ripple USD (RLUSD) market cap has jumped to $2.42 billion.
- XRP ETF inflows have jumped sharply this month.
XRP price remained on edge today, September 10, as the recent crypto market rally stalled. Ripple token dropped to $1.3905, down modestly from this month’s high of $1.6975. This retreat happened even as the XRP ETF inflows jumped and the Ripple USD (RLUSD) growth continued.
XRP ETF Inflows are Soaring
American investors have continued accumulating XRP ETFs this year, a sign that they expect it to do well. These ETFs experienced over $12.9 million inflows on Wednesday, with most of them flowing to Bitwise’s XRP and Grayscale’s GXRP. These funds have had cumulative inflows of over $1.7 billion, with their net assets being at $1.5 billion.
XRP ETFs have now had $27 million inflows this month after adding $159 million in the previous month. They have also had inflows in all months but one since their inception in November last year.
Wednesday’s inflows happened on the same day that spot Bitcoin ETFs shed over $170 million in assets. It also happened as investors embraced a risk-off sentiment as the bond market crashed.
The Dow Jones and Nasdaq 100 indices dropped by over 1% as the ten-year yield jumped to the highest level in over three years.
Ripple USD growth is continuing
Fundamentally, the XRP Ledger network is doing modestly well. For example, the total value locked (TVL) in its ecosystem has jumped to $41 million from last month’s low of $29.5 million.
Similarly, the amount of stablecoins in the ecosystem has jumped to over $1.12 billion. This growth has been driven by Ripple USD (RLUSD), which now holds over $2.4 billion in assets. The remainder of these tokens are in Ethereum Chain.
The soaring amount of RLUSD in XRPL is important because of the growing usage. Artemis data shows that the number of users and the monthly volume has continued rising this year. Its 30-day transfer volume jumped by 30% to $5.45 billion, while the number of holders jumped to 80.7k.
XRP Ledger is also becoming a big chain in the real-world asset (RWA) tokenization industry. There are 377 assets on its chain with the represented asset value rising to over $4.06 billion.
XRP price technical analysis
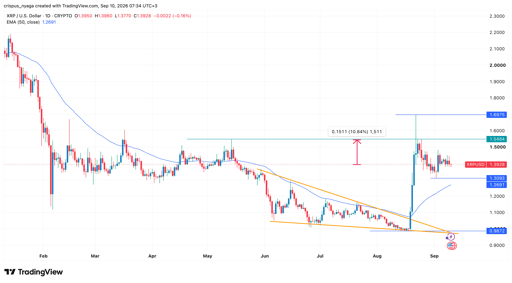
XRP chart | Source: TradingView
The daily chart shows that the XRP price has rebounded in the past few months, moving from a low of $0.9872 in August to a high of $1.6975. This rebound happened after the coin formed a falling wedge pattern, which is made up of two descending and converging trendlines.
The token is now in the process of forming a bullish flag pattern. This pattern is made up of a vertical line and a descending channel. It has remained above the 50-day moving average and the Supertrend indicators.
Therefore, the token will likely have a strong bullish breakout potentially to the key resistance level of $1.5484. This target coincides with the highest swing on May 14 this year. It is about 15% above the current level. A drop below $1.3093 (September 2nd low) will invalidate the bullish outlook.

Ethereum falls below $2,500: is this pullback setting up the next ETH surge?

Solana price at risk of falling below $100 as bearish momentum builds

Zcash jumps 51% in a week: is Grayscale’s ETF fuelling a bigger breakout?

Nikkei 225 Index on edge as foreigners buy, odds of BoJ rate hike jump

Apple stock falls to key support ahead of foldable iPhone launch: buy the dip?
No results found
Loading articles...
Failed to load articles. Please try again.