Solana slides as bears tighten grip, weak demand weighs on price

AI Sentiment: 28/100 Bearish
This score is generated through AI-driven analysis of the article's content.
powered by
Buy BTC and ETH versus SOL (long BTC/USD and ETH/USD, underweight/short SOL). The article flags broad retracements in BTC/ETH but highlights SOL-specific underperformance from weak institutional/retail demand and ETF outflows. If Middle East risk headlines improve, BTC/ETH should lead while SOL lags due to the demand overhang.
Key Risk: A broad crypto risk-off shock hits BTC/ETH harder than SOL, or SOL catches up via a sharp beta-driven rally that overwhelms relative-demand weakness.
Sell SOL (SOL/USD or SOL perpetuals) while it’s below the 50/100/200-day EMAs and retail/institutional demand stays weak: Solana ETF outflows (3 straight weeks), falling futures OI (-3%), and negative funding (-0.0055%) with long-to-short <1. Expect continued sell-side dominance until SOL reclaims the 50-day EMA (~$87) and then the 100-day EMA (~$98).
Key Risk: SOL breaks and holds above the 50-day EMA (~$87) with sustained spot/ETF inflows, flipping momentum and forcing shorts to cover.
- SOL is down 2% and risks dropping below $80.
- Retail and institutional demand for Solana continues to weaken.
- SOL could retest the February low of $77.60 if the sell-off persists.
Bitcoin (BTC), Ethereum (ETH), and Ripple (XRP) have all retraced after hitting key resistance levels.
BTC is trading at $74,000, while Ether and XRP are now around $2,330 and $1.35.
Solana’s SOL is also under pressure, trading just above $80 at press time on Wednesday.
It has lost 2% of its value in the last 24 hours as the lack of institutional support prolongs its consolidation.
Solana’s retail market is also showing signs of a near-term sell-side dominance.
Solana should reclaim the 100-day Exponential Moving Average (EMA) around $100 for a steady recovery.
Poor institutional and retail demand keep SOL under pressure
Solana has been underperforming in recent days due to poor institutional and retail demand.
Institutions are rebalancing their Solana exposure through Exchange Traded Funds (ETFs), which have recorded three consecutive weekly outflows.
Data obtained from CoinGlass showed muted inflows on Solana ETFs since the start of the week, suggesting a lack of interest from institutions.
In addition to that, retail demand for Solana declines amid broader market volatility.
Solana’s futures Open Interest (OI) is down 3% in the last 24 hours and now reads $4.93 billion, suggesting reduced positional exposure.
Furthermore, the funding rate drops to -0.0055%, indicating that traders are willing to hold short positions, evidenced by the long-to-short ratio of 0.9822.
The ongoing Middle East tensions continue to affect the broader cryptocurrency market’s performance.
An agreement between the United States and Iran would effectively end the war and allow assets like Bitcoin and Solana to race higher.
However, with the negotiations set to resume later this week, traders remain cautious, and this is translating into stale price action for Solana and other leading cryptocurrencies.
Solana price forecast
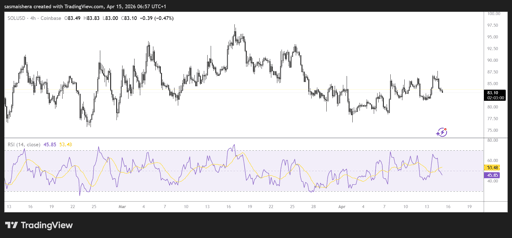
Similar to other leading cryptocurrencies, the SOL/USD 4-hour chart remains bearish and efficient.
SOL is currently in a broadly bearish configuration, trading beneath the 50-day, 100-day, and 200-day Exponential Moving Averages (EMAs).
These EMA levels all act as overhead supply and cap recovery attempts.
The momentum indicators also suggest that the bulls lack the conviction to push SOL’s price higher in the near term.
The Moving Average Convergence Divergence (MACD) indicator shows its line holding in positive territory with a modest bullish tilt.
Furthermore, the Relative Strength Index (RSI) at 53 hovers just above the neutral line, suggesting upside momentum is stabilizing but has yet to overcome the dominant overhead structure.
If the bulls take control of the market and push SOL’s price above the 50-day EMA near $87.29, it would ease immediate downside pressure.
A daily candle close above the 50-day EMA would expose further upside resistance at the Transactional Liquidity (TLQ) and 100-day EMA of $98.24.
An extended rally would allow SOL to surge past the 200-day EMA near $116.85, which reinforces the broader bearish bias.
However, if the bears remain in control, they would encounter immediate support at the February low of $77.60.

XRP price eyes breakout as traders watch familiar technical pattern

Are Ethereum bulls preparing a major breakout above the 100-day EMA?

PEPE price coils below its 50-day EMA as breakout pressure intensifies

Why are ADA traders betting against Cardano after a landmark hard fork?

Why is CORE price going down?
No results found
Loading articles...
Failed to load articles. Please try again.