Is the FTSE 100 Index about to soar as UK Gilt yields plunge?

AI Sentiment: 78/100 Bullish
This score is generated through AI-driven analysis of the article's content.
powered by
Buy FTSE 100 exposure (e.g., iShares Core FTSE 100 UCITS ETF or UKX index CFD). Falling 10Y gilt yields (4.95% from 5.20%) plus a technical breakout (back above the 50-day EMA, inverted head-and-shoulders) points to continued multiple expansion. Macro is mixed but the market is pricing fewer BoE cuts, which still supports bonds and risk assets when yields fall. Bulls target ~£10,800 after holding ~£10,160 support.
Key Risk: 10Y gilt yields reverse higher and the FTSE breaks below £10,160, killing the rebound setup.
Buy UK gilts (e.g., iShares Core UK Gilts UCITS ETF; focus on 5–10Y). The article shows a bond market comeback with 10Y and 5Y yields dropping for two straight days on cooling inflation prints and weaker labor/retail data. If yields keep sliding, it reinforces the FTSE bid and gives you direct carry/price gains from duration.
Key Risk: Inflation re-accelerates or Ofgem’s July price hike forces yields back up, wiping out the duration trade.
- The FTSE 100 Index may be on the verge of a breakout this year.
- UK Gilt yields have pulled back in the past few days.
- The UK published weak inflation, retail sales, and jobs data.
The FTSE 100 Index did relatively well this week, rising for four consecutive days and reaching its highest point since May 6 this year. It rose to £10,445 on Thursday, up slightly from the key support of £10,160. So, will the index continue rising as UK gilt yields drop?
UK released mixed macro data this week
The FTSE 100 Index rose as the UK published mixed macro data that lower the probability that the Bank of England (BoE) will cut interest rates this year.
A report released on Tuesday showed that the UK vacancies dropped to the lowest level in five years. The unemployment rate rose to 5%, while the number of people on payrolls dropped by 100,000.
Another report released on Wednesday showed that the UK’s inflation rate retreated in April. The headline consumer price index (CPI) dropped to 2.8%, while the core CPI retreated to 2.5%. These metrics dropped because of the actions by Ofgem.
Still, the reprieve will likely be brief as Ofgem is expected to hike prices in the next update in July. Besides, crude oil and natural gas prices have continued rising this year because of the Iran war.
Another report released today showed that the UK retail sales dropped sharply in April. Retail sales fell by 1.3% MoM, while core sales fell by 0.4%. These are notable numbers because they provide color on the state of the British economy and consumer.
The numbers have helped to fuel a bond market comeback. Data shows that the yield of the 10-year Gilts dropped for two consecutive days to 4.95%, moving from the year-to-date high of 5.20%. Five-year yields dropped to 4.5% from this month’s high of 4.72%. The stock market often does well when bond yields are falling.
The FTSE 100 Index also reacted to some important corporate earnings. For example, BT Group published a mixed report, which showed that its broadband subscriptions fell by 850k, much lower than the expected 1 million+. Other FTSE 100 companies that published their earnings are Burberry, 3i Group, Land Secuities, National Grid, and ICG.
Looking ahead, the Footsie will have no major catalyst. The only potential one that may have an impact is political, where Keir Starmer is fighting for his life.
FTSE 100 Index technical analysis
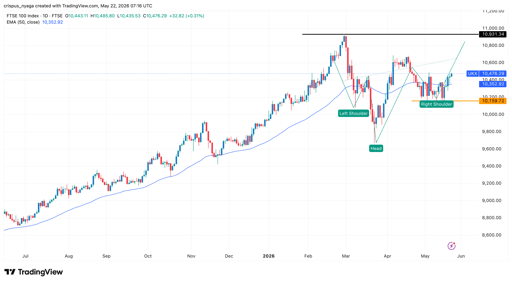
Footsie stock chart | Source: TradingView
The daily chart shows that the FTSE 100 Index has rebounded in the past few days, rising from a low of £10,120 to the current £10,443. It has already moved above the 50-day Exponential Moving Average (EMA), a sign that bulls are gaining momentum.
The index also failed to move below the key support level at £10,160 for several days, a sign that bears are afraid of placing a bear trade. Also, it has formed an inverted head and shoulders pattern.
Therefore, there is a likelihood that the index will likely continue rising as bulls target the next key resistance being at £10,800. A drop below the support at £10,160 will invalidate the bullish view,

Corning stock jumps 5% after this analyst sees opportunity after recent sell off

Why Tesla stock is surging over 3% on Monday

Why are investors loading up on Serve Robotics stock ahead of Q2 earnings?

AMZN stock jumps, pushing Amazon past $3T valuation as AWS calms AI spending fears

Bristol-Myers stock: why AstraZeneca merger is unlikely to happen
No results found
Loading articles...
Failed to load articles. Please try again.