Bitcoin price prediction: JPMorgan flags BTC risk, miner revenue hits 2022 low

AI Sentiment: 22/100 Bearish
This score is generated through AI-driven analysis of the article's content.
powered by
Buy Bitcoin miners (e.g., MARA, RIOT, CLSK) because miner economics are deteriorating toward 2022-style stress (Puell Multiple falling to 0.74; severe strain past -15% on the stress metric). If BTC stabilizes above the 200-week SMA (~$62k) and the market starts pricing capitulation, the operating leverage of miners can produce sharp upside from depressed expectations.
Key Risk: BTC breaks and holds below $62k, forcing further miner shutdowns and sustained dilution/solvency risk.
Sell exposure to Bitcoin using US spot Bitcoin ETFs (e.g., short the ETF basket like IBIT/FBTC) because JPMorgan flags a “broad-based retreat of the debasement trade” and ETF flows show $2.1B outflows since June start plus $10.5B cumulative since Oct 12—classic momentum headwind. Technicals also warn: BTC is under the 20-week and 50-week SMAs and needs a 4-hour close above $64k to confirm the ascending triangle; otherwise downside risk to $60k then $51k.
Key Risk: A clean weekly breakout above the $81.8k–$82k neckline that flips flows back to inflows and invalidates the bear-flag risk.
- JPMorgan sees BTC ETFs at a record $10.5 billion outflow since October 2025.
- Bitcoin's 200-week SMA at $62,000 is the line separating recovery from a $51,000 drop.
- Miner capitulation indicator at -21% signals growing risk of mass shutdowns.
At the time of writing, Bitcoin price was around $63,752, recovering from a weekly low of $59,353 but still sitting 49.4% below its all-time high of $126,080 reached on October 6, 2025.
The price is caught between a developing bullish pattern on shorter timeframes and a string of troubling macro and onchain signals that continue to weigh on sentiment.
JPMorgan flags the debasement trade unwind
JPMorgan’s analysts described what is happening in the market as a "broad-based retreat of the debasement trade," a macro thesis that had previously channeled billions of dollars into both Bitcoin and gold as hedges against currency devaluation.
The trigger, according to the bank, is the thawing of US-Iran tensions, which has removed the geopolitical urgency that was propping up risk-off assets.
The effect has been visible in fund flow data. US spot Bitcoin ETFs have shed $2.1 billion since the start of June, and gold ETFs saw $20 billion exit in the single week through June 5.
Zooming out further, Bitcoin ETFs have recorded $10.5 billion in cumulative outflows since October 12, 2025, a figure that analyst Darkfost describes as the steepest drawdown since these products launched.
Fabian Dori, chief investment officer at Swiss digital asset bank Sygnum, pushes back on the most bearish interpretation of those numbers.
Dori's view is that the bulk of the selling is mechanics, not conviction, specifically, the unwinding of cash-and-carry arbitrage positions as the futures basis premium compresses.
He points to stable exchange flows and steady stablecoin supply as evidence that there is no broad flight from the asset class.
Despite its near-term warning on the debasement trade, JPMorgan has not walked back its longer-term Bitcoin price targets.
The bank's 6-to-12-month estimate sits at $170,000, while its structural long-run target of $266,000 is built on a model comparing Bitcoin's market size to the roughly $8 trillion held in private-sector gold, adjusted for the volatility gap between the two assets.
Bitcoin price technical analysis: $64K is the price to watch
The four-hour chart shows Bitcoin constructing an ascending triangle since the June 4 crash.
The pattern is defined by a flat ceiling in the $63,800–$64,000 area, where multiple recovery attempts have stalled, and a rising floor of higher lows that signals buyers are stepping in at progressively better levels.
The resolution of this pattern hinges on whether Bitcoin can print and hold a four-hour candle close above $64,000.
If that happens, the technical measured move points to $68,000–$68,200, which is also a historically significant resistance zone from earlier in the year.
Pulling back to the weekly chart, Bitcoin is clinging to its 200-week simple moving average near $62,000.
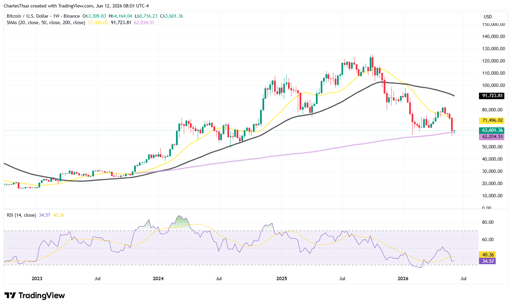
That level has played a defining role in previous cycles, acting as the floor during prolonged bear markets.
The fact that Bitcoin bounced from $59,353 without decisively cracking that average has opened up a potential double-bottom structure on the weekly timeframe.
Holding above the 200-week SMA and building upward momentum from here would put the 20-week SMA at $71,500 in view as the first target.
Beyond that, the double-bottom neckline sits in the $81,800–$82,000 range.
A weekly close above that neckline would technically project a move toward $115,000–$116,000 over the longer term.
The weekly RSI reading of 34.57 is a reminder that momentum has not turned yet.
Bitcoin is also trading under both its 20-week and 50-week SMAs, meaning the recovery remains unconfirmed at the broader timeframe level.
The scenario bulls need to avoid is a weekly close under $62,000 that then extends below $60,000.
That sequence would cancel the double-bottom thesis and instead confirm a bear flag on the weekly chart, a structure that carries a downside projection to $51,000.
Bitcoin miner revenue is approaching 2022 stress levels
The price weakness is hitting Bitcoin miners hard, and the data is starting to resemble conditions last seen during the 2022 bear market.
The Puell Multiple, which measures a miner's daily revenue relative to the 365-day average, has slid from 0.83 at the end of May to 0.74 over the past two weeks.
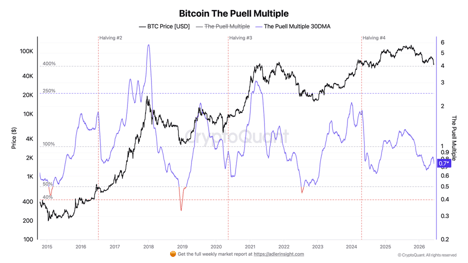
Analyst Axel Adler Jr. has pointed out that readings near 0.50 on this metric have historically lined up with mass miner shutdowns, the kind of capitulation event that defined the 2022 cycle bottom.
While the current reading is not there yet, the direction is clear.
The miner capitulation indicator reinforces the stress picture.
At -21%, it is sitting well past the -15% level that marks severe financial strain across the mining industry, indicating that a substantial portion of the network is either barely breaking even or actively losing money per block mined.
JPMorgan had already drawn attention to the deteriorating economics of mining earlier this year.
The bank noted that Bitcoin's average production cost fell from around $94,000 in late 2025 to approximately $77,000 in early 2026, as rising energy costs and falling prices forced the least efficient miners offline, reducing the overall network hashrate.
With BTC still trading more than $13,000 below that $77,000 cost estimate, the squeeze on miners has not eased, and some miners could be forced to sell their Bitcoin reserves to keep operations funded.

Pi Network price forecast: Will Protocol v25 boost overcome token unlock pressure?

DEXE price crashes 80% in 24 hours as alleged team sell-off sparks panic

Movement (MOVE) files for Chapter 11 as $141.4M in funding fails to prevent collapse

XRP stalls below key EMAs: is this recovery weaker than it looks?

Cardano hits a wall near $0.178 as leveraged demand starts to fade
No results found
Loading articles...
Failed to load articles. Please try again.