Bitcoin price prediction: Glassnode sees bottoming signs despite surging ETF outflows

AI Sentiment: 58/100 Bullish
This score is generated through AI-driven analysis of the article's content.
powered by
Buy BTC spot. The setup is a real bottoming mix: extreme fear (Fear & Greed at 20), Glassnode showing long-term holders absorbing supply, and bullish divergence (RSI back from ~15 to ~40; PPO turning up). Even with ETF outflows, the price is already stabilizing and the next upside magnet is $65,000. Key risk: Strategy’s selling accelerates and breaks $55,000 support, overwhelming holder absorption and triggering a fresh selloff.
Key Risk: Strategy’s continued coin sales break $55,000 and spark a new downtrend.
Sell/short spot Bitcoin ETF exposure (e.g., short iShares Bitcoin Trust ETF—IBIT). The article flags persistent, heavy outflows ($748M this week; $4.5B in June) and eight straight weeks of selling. If BTC bounces, it may still be muted versus spot because ETF flows are a direct headwind. This trade targets underperformance of ETFs relative to BTC during the bounce. Key risk: ETF outflows reverse sharply (new inflows) and the ETF premium/price catches up fast.
Key Risk: ETF outflows flip to sustained inflows, forcing a fast ETF rebound.
- Bitcoin price remained on edge on Thursday as ETF outflows jumped.
- Spot Bitcoin ETF outflows have hit $748 million this month.
- There are signs that Bitcoin price is starting to bottom this year.
Bitcoin price rose for the second consecutive day despite the rising ETF outflows and fear that Strategy will dump some of its holdings. BTC jumped to $60,870, up modestly from the year-to-date low of $58,000.
Spot Bitcoin ETF outflows continued
Demand for Bitcoin remains thin this week as investors continued their selling spree. Data compiled by SoSoValue shows that spot BTC ETFs have suffered outflows worth over $748 million so far this week. It is the eight consecutive week in which investors have dumped these ETFs.
Bitcoin ETFs lost over $4.5 billion in June alone, the worst performance since they were approved in 2024. This performance is happening as investors capitulate after Bitcoin underperformed the stock market in the past few years.
Investors are also looking to rotate to the booming AI sector, where top stocks like Micron, Sandisk, and Western Digital have jumped by triple digits this year.
Making the stuation worse is a report that Michael Saylor’s Strategy is starting to sell its Bitcoin, a move aimed at boosting its cash reserves. The urgency of the sales jumped last week as its preferred stocks like STRC, STRD, and STRF plunged below their peg.
By selling its coins, Strategy has abandoned its long-held view that it will never sell Bitcoin. As we saw last month, its selling may lead to more weakness. Bitcoin dropped below the support of $60,000 after selling 32 coins.
Potential catalysts for BTC remains
Despite the doom and gloom, there are some potential catalysts that may boost Bitcoin price in the second half of the year. First, there are signs that memory companies that dominated the first half are losing momentum.
Companies like Micron and Sandisk plunged sharply on Wednesday. If this trend continues, there will likely be a sector rotation to industries that have lagged the market recently. Indeed, many software stocks have started rising this month.
At the same time, the Crypto Fear and Greed Index has slumped to the extreme fear zone of 20. In most cases, Bitcoin and other cryptocurrencies rebound when sentiment in the market sinks.
A good example of this happened in February when the index retreated to the fear zone. Bitcoin then bounced back after that. This scenario also happened after Bitcoin retreated in April last year when President Donald Trump announced his reciprocal tariffs.
Meanwhile, a study by Glassnode shows that long-term Bitcoin holders are starting to absorb supply. While the amount is low, the report suggested that it was signaling earlier signs of Bitcoin bottoming.
Bitcoin price technical analysis
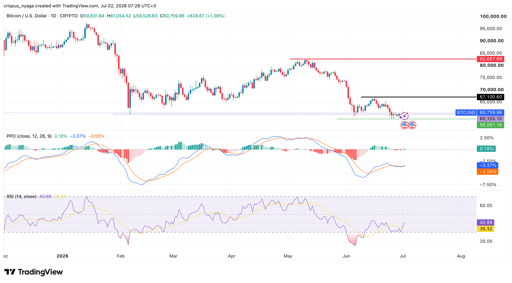
BTC price chart | Source: TradingView
There are signs that Bitcoin is also forming a bullish divergence pattern. This pattern normally happens when an asset is falling, while top oscillators are moving upwards.
In this case, the Relative Strength Index (RSI) has moved from the oversold level of 15 to the current 40. The two lines of the Percentage Price Oscillator (PPO) have also reversed and are pointing upwards.
Therefore, the coin will likely bounce back in the near term. If this happens, the next key level to watch will be at $65,000. A drop below the support of $55,000 will point to more downside.

Magnificent 7 face the ultimate test as Q2 earnings loom

DEXE price crashes 80% in 24 hours as alleged team sell-off sparks panic

Movement (MOVE) files for Chapter 11 as $141.4M in funding fails to prevent collapse

XRP stalls below key EMAs: is this recovery weaker than it looks?

Cardano hits a wall near $0.178 as leveraged demand starts to fade
No results found
Loading articles...
Failed to load articles. Please try again.