
Why is Ethereum falling after briefly breaking above the $1,930 level?

AI Sentiment: 28/100 Bearish
This score is generated through AI-driven analysis of the article's content.

powered by

Second-order effect: when ETH sells off due to higher yields and risk-off, capital rotates out of leveraged crypto longs into cash-like yield. Use USDC as the crypto-native parking asset, or buy short-duration US Treasuries to benefit if longer-dated yields stay elevated and volatility rises. This positions you to buy ETH back lower if $1,823/$1,750 break.
Key Risk: A fast risk-on reversal (yields drop, oil cools, geopolitics de-escalates) that pulls liquidity back into ETH and other high-beta crypto immediately.
ETH rallied on ETF inflows and short liquidations, then reversed as geopolitics (US–Iran) triggered broad risk-off and higher oil pushed inflation fears back up. That combination lifts yields and hurts risk assets, and it also makes staking returns less compelling versus bonds. Technicals confirm: ETH failed to hold above ~$1,900 and is back near the 0.5 fib (~$1,846), with downside levels at ~$1,823 then ~$1,785–$1,750 if support breaks. Sell ETH spot or short via ETH perpetuals.
Key Risk: A clean reclaim and hold above $1,900–$1,930 that turns the move back into a sustained uptrend (especially if macro yields fall and ETF inflows persist).
- Ethereum climbed above $1,930 before retreating to around $1,850.
- Fresh macro risks have pressured Ethereum price action.
- Analysts remain split, with $1,750 emerging as Ethereum's key support level.
Ethereum has climbed above $1,930 before retreating toward $1,850, as an early-week rally driven by ETF inflows and easing macro expectations has given way to renewed geopolitical and macroeconomic pressure.
CoinGecko data showed Ethereum ETH touched an intraday high of about $1,931 on July 15, its strongest level in weeks, before slipping to around $1,850 over the past 24 hours.
The token was down roughly 3.5% on the day at the time of writing, although it remained more than 4% higher over the past seven days.
Several factors combined to fuel the initial advance.
Softer-than-expected US economic data, including weaker labor market readings, strengthened expectations that the Federal Reserve could ease monetary policy sooner than previously expected.
The weaker dollar and improving appetite for risk assets encouraged buying across cryptocurrencies.
Institutional demand also improved after spot Ethereum exchange-traded funds reversed a prolonged stretch of outflows.
Around July 15, products including BlackRock's iShares Ethereum Trust recorded fresh net inflows, adding buying pressure as institutional investors returned to the market.
As ETH cleared resistance around the $1,800-$1,840 area, derivatives markets added further momentum.
Short sellers were forced to close bearish positions, creating a wave of short liquidations that helped push the token above $1,900 before the rally stalled.
The rebound, however, quickly lost steam as macro risks resurfaced.
Renewed tensions between the United States and Iran triggered a broader risk-off move across financial markets, weighing on both technology stocks and cryptocurrencies.
At the same time, higher crude oil prices revived concerns that inflation could remain elevated, reducing expectations for imminent Federal Reserve rate cuts.
Longer-dated US Treasury yields also moved higher during the geopolitical uncertainty.
Rising government bond yields typically reduce the appeal of higher-risk assets, while narrowing the relative attractiveness of Ethereum's staking returns for institutional investors.
Because much of the move toward $1,930 had been supported by leveraged futures positions, the subsequent decline accelerated after ETH slipped below roughly $1,880.
Falling prices forced leveraged long traders to unwind positions, increasing selling pressure and sending the token back toward the mid-$1,800 range.
Beyond the immediate macro backdrop, Ethereum continues to face longer-term structural challenges.
Layer-2 networks such as Base and Arbitrum have shifted a growing share of transaction activity away from Ethereum's main chain following the Dencun upgrade, reducing fee revenue and weakening the network's token-burning mechanism.
The major Glamsterdam upgrade, which developers expect to improve scalability and reduce gas costs, has also been delayed until the latter half of the third quarter, leaving investors without a major near-term network catalyst.
Ethereum price analysis
The technical picture shows that Ethereum has entered a pullback after failing to hold above $1,900, although the broader recovery from late June remains intact.
On the daily chart, ETH has retreated from the recent high near $1,931 toward the 50-day exponential moving average, while continuing to trade below the 200-day EMA.
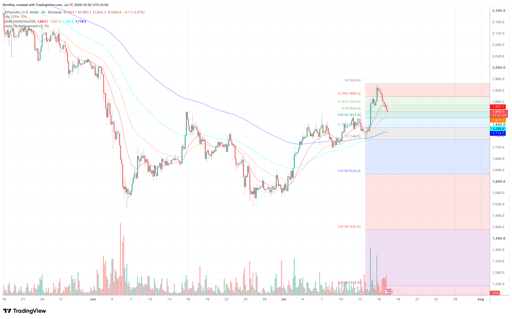
ETH/USD 1-day price chart. Source: TradingView.
This suggests buyers have regained some momentum over recent weeks, but the longer-term trend has yet to fully turn bullish.
The current decline has brought prices back to the 0.5 Fibonacci retracement level around $1,846, where buyers have started defending support.
Below that, the 0.618 retracement near $1,823 becomes the next important level.
A break beneath that area could expose $1,785-$1,750, which also aligns with the 100-day and 200-day EMA cluster on the four-hour chart.
The 4-hour chart points to weakening short-term momentum after ETH was rejected near the 0.236 Fibonacci level around $1,898.
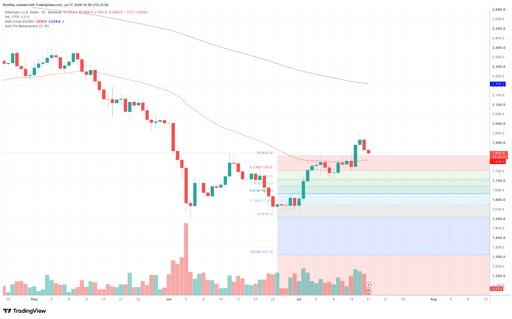
ETH/USD 4-hour price chart. Source: TradingView.
Price has formed lower highs during the past 24 hours, while sellers have gradually pushed the token back toward the middle of its recent trading range.
If buyers reclaim the $1,900-$1,930 region, attention could return to the next horizontal resistance zone around $2,100-$2,160.
On the downside, losing support around $1,823 would increase the risk of another test of $1,750, a level that several market participants consider critical for preserving the recent recovery.
Analysts split over Ethereum's next move
Market analysts remain divided on whether Ethereum has started building a lasting recovery or is still trading within a broader downtrend.
Crypto analyst Daan Crypto Trades said ETH has successfully turned the $1,750 horizontal level into support, describing it as the first meaningful reclaim of a previous resistance area during the current downtrend.
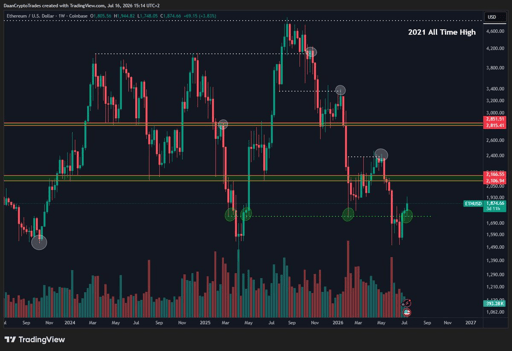
ETH/USD 1-week price chart. Source: Daan Crypto Trades on X.
According to Daan, a successful hold above that level could support a move toward the long-standing $2,100 resistance zone, while a drop below $1,750 would invalidate the bullish setup.
A more cautious view came from Mister Crypto, who argued that Ethereum continues to respect a long-term descending trendline that has rejected the price four times since its 2025 peak.
According to the analyst, ETH has yet to break that resistance decisively, meaning recent rallies still qualify as lower highs within the broader bearish structure.
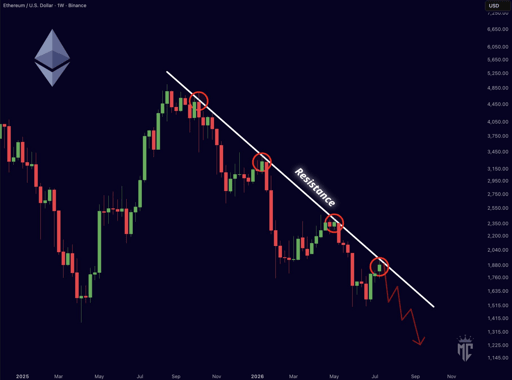
ETH/USD 1-week price chart. Source: Mister Crypto on X.
A sustained break above the trendline is needed before the longer-term outlook improves, the analyst said, adding that continued rejection could leave the token vulnerable to a deeper decline toward $1,200.

Why XRP traders are watching $1.47 as Evernorth and ETF demand build pressure

ENA explodes 10% as Ethena moves to kill its biggest token overhang

Can Ethereum price reclaim $2,500 as ETF demand battles profit-taking?

Why is Strategy (MSTR) stock gaining 12% today

Bitcoin hits resistance with $2.9B in longs at risk below $68,000
No results found
Loading articles...
Failed to load articles. Please try again.