
Bitcoin smashes through $71,000: how high can this breakout run?

AI Sentiment: 78/100 Bullish
This score is generated through AI-driven analysis of the article's content.

powered by

Buy spot Bitcoin (BTC-USD) or a BTC ETF. The catalyst is improving liquidity from expanded Treasury long-bond buybacks, and the chart is already breaking $71,000 with momentum: reclaiming the 50% Fib (~$70,325) and challenging the 200-day EMA (~$71,941). Thesis: a daily close above ~$71,941 turns resistance into support and opens a move toward ~$77,489 (78.6% Fib), then ~$82,850.
Key Risk: BTC fails to hold above the 200-day EMA (~$71,941) and quickly falls back below ~$70,325, triggering a momentum unwind and deeper retracement.
Buy Ethereum (ETH-USD) or an ETH ETF as a higher-beta beneficiary of the same liquidity impulse. If BTC clears ~$71,941 and targets ~$77,489, capital typically rotates into the rest of crypto; ETH tends to outperform during sustained risk-on legs when BTC leads.
Key Risk: BTC breakout stalls and ETH underperforms due to a risk-off rotation back into BTC only, with ETH breaking down below its key moving-average support.
- Broader crypto market is strengthening amid renewed bullish momentum.
- Bitcoin is trading near the $69,800 level after surging 8.5% on Wednesday.
- A sustained break above $71,941 could open the path toward $77,489.
The broader cryptocurrency market is regaining momentum as improving liquidity conditions fuel expectations of another bullish leg.
Bitcoin has broken past the psychologically important $70,000 mark after rallying 7% on Wednesday and it is now trading above $71,000.
The rally followed the US Treasury Department’s decision to expand buyback operations for longer-dated government securities in an attempt to support market liquidity and ease rising borrowing costs.
JUSTIN: bitcoin:native surges past 70,000.
— Invezz (@InvezzPortal) August 20, 2026
US Treasury doubles long-term bond buybacks
The US Treasury announced that it will at least double the maximum size of its liquidity-support buybacks for longer-dated nominal securities.
The maximum value of each operation will increase from $2 billion to at least $4 billion.
By increasing its purchases of longer-term bonds, including securities in the 10-year to 30-year range, the Treasury can support market liquidity and place downward pressure on yields.
Lower long-term yields can improve financial conditions and encourage investors to move toward riskier assets, including stocks and cryptocurrencies.
However, the buyback program is a liquidity-management measure and should not be interpreted as a conventional quantitative easing program.
Bitcoin Technical outlook: Could BTC surpass $70,000?
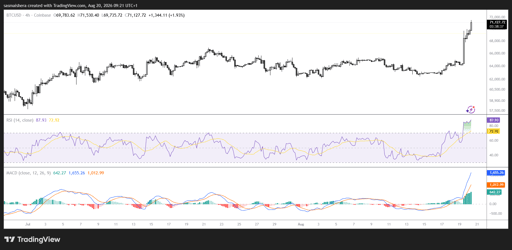
The BTC/USD 4-hour chart has turned bullish thanks to the latest rally. Bitcoin is up by 10.9% in the last 24 hours and is now trading around $71,228.
BTC remains comfortably above the 50-day Exponential Moving Average at $64,766. It has also reclaimed the 23.6% Fibonacci retracement at $63,711, measured from the decline between the $82,850 swing high and the $57,800 low.
The price has surpassed the 50% Fibonacci retracement at $70,325, which represents the first major resistance level.
Beyond that barrier, the 200-day EMA at $71,941 could present a more significant test for buyers and determine whether Bitcoin’s recovery develops into a sustained rally.
A decisive daily close above the 200-day EMA at $71,941 would strengthen Bitcoin’s bullish structure and increase the likelihood of further gains.
If buyers establish support above that level, BTC could advance toward the 78.6% Fibonacci retracement at $77,489.
A successful move beyond $77,489 could bring the previous swing high of $82,850 back into focus.
For this bullish scenario to remain intact, Bitcoin must convert the resistance zone between $70,325 and $71,941 into support.
Bitcoin’s technical indicators support the bullish outlook, although they also signal that the rally may be becoming stretched.
The Relative Strength Index stands near 72, placing it in overbought territory. This reading reflects powerful buying momentum but may also increase the likelihood of profit-taking or a short-term consolidation.
Meanwhile, the Moving Average Convergence Divergence indicator remains well above both its signal and zero lines. Its expanding positive histogram reinforces the view that bullish momentum is strengthening.
Together, the indicators suggest that buyers remain in control, although traders should be alert to potential volatility around the $70,000 and $71,941 resistance levels.
If Bitcoin fails to clear the nearby resistance zone, the 50-day EMA at approximately $64,766 would provide the first significant area of support.
Buyers could attempt to defend this level and preserve the latest upward leg.
A deeper correction would expose the 23.6% Fibonacci retracement at $63,711. Below that, an ascending trendline near $62,766 could offer additional support.
A decisive break beneath the trendline would weaken the bullish outlook and raise the risk of a broader retracement.

Can BitMine’s ETH buying push Ethereum price toward $2,600?

USELESS price risks 50% correction after 900% rally

BitMine stakes 85% of its ETH: why $330M barely changes the risk equation

XRP price is flashing a 48% upside setup, but $1.50 must break first

Bitcoin rebounds $1,500 from its intraday low: who keeps buying near $77K
No results found
Loading articles...
Failed to load articles. Please try again.