
USD/JPY signal: forecast as Japanese yen surges amid BoJ rate hike bets

AI Sentiment: 18/100 Bearish
This score is generated through AI-driven analysis of the article's content.

powered by

Buy yen by selling USD/JPY (e.g., FX spot or USD/JPY CFD). BoJ hike odds are near-certain for Sept 18, Japan yields are already up, and the pair is technically broken (below 50/100-day EMAs after a rising wedge/bearish reversal). Expect continued grind lower toward 155.25, with momentum if NFP doesn’t re-ignite USD strength.
Key Risk: Fed hikes more than expected (or NFP is strong), widening the rate gap and forcing USD/JPY to bounce hard.
Sell JPY carry risk via long JPY vs high-yield proxies: short USD/JPY and/or buy protection by selling JPY-funded risk (e.g., short JPY against NZD/AUD if available, or reduce exposure to JPY-funded EM/credit ETFs). The news raises the odds of a sustained BoJ tightening path, which makes carry trades less attractive and triggers forced unwinds.
Key Risk: Markets decide BoJ hikes are “one-and-done” while the Fed stays dovish, keeping the carry trade intact and limiting JPY gains.
- The USD/JPY pair plunged as odds of a BoJ rate hike jumped.
- Traders also expect the Federal Reserve to hike rates as soon as in September.
- The pair formed a rising wedge pattern before the current plunge.
The USD/JPY exchange rate dived to its lowest level in a month as the Japanese yen made a strong comeback. It dropped to 156.85, down over 4.40% from its year-high as investors predicted that the Bank of Japan (BoJ) will hike interest rates as soon as this month.
Polymarket odds of BoJ rate hikes are rising
Markets are expecting the Bank of Japan to hike interest rates in its September 18 meeting. A Polymarket event contract has a 97.5% probability of this hike happening.
These odds have jumped after recent statements by senior BoJ officials, including Governor Kazuo Ueda and Deputy Governor Ryozo Himino. They have hinted that the bank will be comfortable implementing another rate hike as inflation has held steady this year.
The most recent data showed that the Tokyo CPI jumped 1.9% in August from 1.8% in the previous month. It has been in a steady increase since bottoming at 1.3% in May this year.
This trend will continue in the foreseeable future since the US and Japan have restarted their war. Iran carried out strikes against key US allies like Kuwait and Bahrain, leading to higher crude oil prices. Brent has jumped to over $95, while the West Texas Intermediate (WTI) has moved to $91.
Japan is highly exposed to the events in the oil market because it imports from the Middle East, including countries like Saudi Arabia, UAE, Kuwait, and Qatar. Rising oil prices mean that inflation will continue rising in the coming months.
The rising BoJ hike odds comes at a time when Japan’s bond yields have soared to the highest level in years. The ten-year yield rose to 3.03%, much higher than the year-to-date low of 2.045%.
Similarly, the 30-Year rose to 4.20% before falling to 4.068% today as the odds of BoJ rate hike rose.
The challenge for the Japanese yen, however, is that the Federal Reserve is also expected to hike interest rates in the coming meetings. Odds of the Fed hiking rates in September jumped to 60% on Polymarket.
A Fed and BoJ hike would leave the differential where it is today, making the Japanese yen a popular carry trade funding currency. A carry trade is a situation where investors borrow from a low-interest-rate currency and then invest it in a high-interest-rate one.
The next important catalyst for the USD/JPY pair is the upcoming US nonfarm payrolls data. Economists expect the economy to have added between 50k and 80k jobs in August after shedding 23k a month earlier.
USD/JPY technical analysis
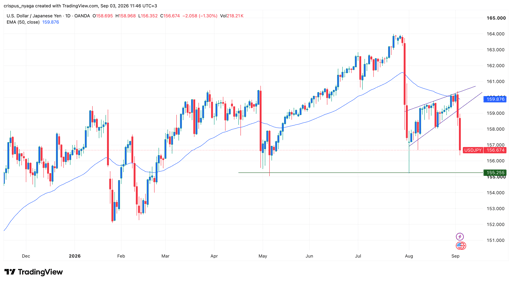
USDJPY chart | Source: TradingView
The daily chart shows that the USD/JPY crashed to a low of 156, its lowest level since August 7. This retreat happened after the pair formed a rising wedge pattern, which is made up of two ascending and converging trendlines. This pattern is one of the most common bearish reversal sign in technical analysis.
The wedge was part of bearish pennant pattern, which happens after an asset makes a big dive. It has now remained below the 50-day and 100-day Exponential Moving Averages (EMA).
Therefore, the pair will likely continue falling, potentially to the key support level at 155.25. A move below that support will point to more downside.

Crude oil price forecast as Iran ramps up attacks on Kuwait

AUD/USD signal: forecast as RBA and Fed rate hike odds rise

Credo Technology stock has slipped after earnings: how low can it get?

Snowflake stock forms bearish divergence as earnings loom: will it rise or crash?

HPE stock forms rare cup-and-handle pattern as Dell earnings set up key catalyst
No results found
Loading articles...
Failed to load articles. Please try again.