
Is Zcash setting up for $1,300 as ETF demand keeps squeezing short sellers?

AI Sentiment: 78/100 Bullish
This score is generated through AI-driven analysis of the article's content.

powered by

Buy ZEC. ETF inflows (ZCSH) are the core driver, and price is still above all key moving averages with positive Chaikin Money Flow (buying pressure > selling). The setup is a squeeze: major short-liquidation clusters sit at ~$1,215–$1,220, then ~$1,245–$1,255 and ~$1,265–$1,280. A daily close above ~$1,250 targets ~$1,300.
Key Risk: ZCSH inflows stall or reverse and ZEC fails to hold above ~$1,170, triggering a fast unwind back toward ~$1,074/$900.
Buy ZEC on dips, not after breakouts. Use the liquidation map: if ZEC tags ~$1,215–$1,220 or ~$1,245–$1,255, shorts are likely forced to cover into the move, creating quick upside continuation. This is a momentum trade around known liquidity pockets while the trend remains intact (bullish EMA stack).
Key Risk: A clean breakdown below ~$1,074 (4-hour Bollinger mid) that signals the squeeze is over and liquidity flips to the downside.
- ZEC has gained nearly 12% in 24 hours, briefly reaching $1,249.
- The break above $1,000 triggered heavy short liquidations.
- ZEC remains above its major daily EMAs, with CMF staying firmly positive.
Zcash price has climbed nearly 12% over the past 24 hours to around $1,190 on Sept. 7, extending its seven-day gain to more than 45% after ZEC briefly traded near $1,250.
CoinGecko data puts ZEC at roughly $1,193 at the time of writing, after the privacy coin moved from below $1,100 to an intraday high near $1,249.
The latest move extends a breakout that took Zcash above $1,000 on Sept. 4.
Grayscale’s Zcash ETF remains the main catalyst behind the move.
The ZCSH spot ETF began trading on NYSE Arca on Aug. 25, opening a regulated route for US investors seeking direct exposure to ZEC.
The fund had recorded at least $34.4 million in net inflows by Sept. 4, including $12.6 million on Sept. 2 alone.
ZCSH’s net assets have since reached roughly $463 million, keeping ETF demand in focus after the initial launch.
ZEC’s move through $1,000 has accelerated the price action, with the token gaining roughly 20% during the Sept. 4 session before holding above four figures and pushing through $1,100 and $1,200 over the following sessions.
At the same time, leveraged traders have contributed to the speed of the move.
The first break through $1,000 liquidated roughly $34 million to $36 million in bearish positions, while traders continued to build short exposure as ZEC moved higher.
Coinglass’ 24-hour liquidation heatmap shows several remaining liquidity concentrations above the current price. See below.
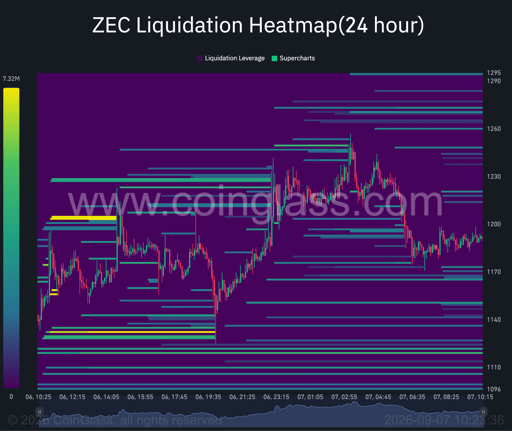
ZEC 24-hour liquidation heatmap. Source: Coinglass.
Clusters sit around $1,215 to $1,220, followed by $1,245 to $1,255 and $1,265 to $1,280. If ZEC moves through those zones, short liquidations could contribute to buying as traders close bearish positions.
Below the market, the heatmap places liquidity around $1,165 to $1,170, with larger concentrations near $1,130 to $1,140 and $1,105 to $1,120.
Interest in Zcash’s privacy technology has run alongside the ETF demand.
Grayscale positioned ZCSH as a way to gain exposure to financial privacy when it launched the fund, bringing the privacy-coin theme into a US-listed investment product.
Zcash’s NU7 governance process is providing a separate development catalyst.
Zcash Labs has scheduled the coinholder vote to close on Sept. 14, with eligible ZEC holders voting on the scope and readiness of NU7.
The process requires eligible funds to have been spendable and shielded in the Ironwood pool at the Aug. 24 snapshot.
ZEC price analysis
ZEC’s daily chart has become increasingly stretched after the price moved from the $800 area at the start of September to nearly $1,250.
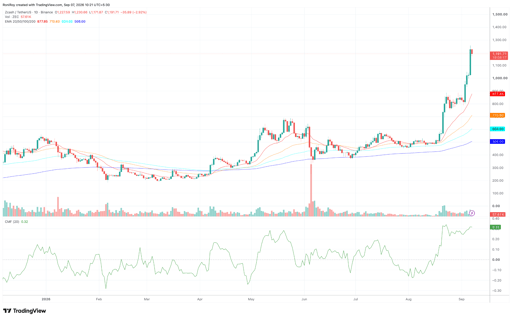
ZEC/USDT 1-day price chart. Source: TradingView.
The 20-day exponential moving average has climbed to $877.85, while the 50-day EMA sits at $710.60. The 100-day and 200-day averages are lower at $604.60 and $506.00.
Price remains above all four averages, and their bullish ordering supports the trend that began before the latest breakout.
Chaikin Money Flow stands at 0.32 on the daily chart. The indicator has remained firmly above zero during the latest move, meaning buying pressure has continued to outweigh selling pressure even as ZEC moved above $1,000.
The immediate resistance sits around the recent $1,249 high.
A daily close above $1,250 could open a move towards $1,300, with $1,400 becoming the next price area if buyers maintain control.
On the 4-hour chart, ZEC is trading near $1,191 after touching the upper Bollinger Band during the latest push. See below.
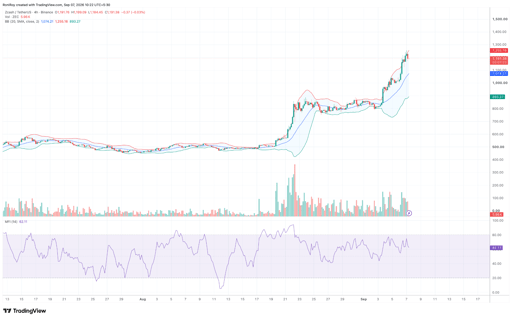
ZEC/USDT 4-hour price chart. Source: TradingView.
The upper band is at $1,255.16, almost matching the recent price high, while the middle band has risen sharply to $1,074.21.
ZEC has moved back below the upper band after testing $1,250, leaving $1,255 as the first level that needs to be cleared for the breakout to continue.
The Money Flow Index is at 62.11, below the 80 level normally associated with overbought conditions, despite the sharp rise in price.
A failure to regain $1,250 could bring $1,170 into focus first, where the liquidation heatmap shows a concentration of leveraged positions.
Below it, the Bollinger Band midpoint around $1,074 becomes an important support level.
The lower Bollinger Band currently sits near $893.27. A fall through $1,074 would therefore leave a much larger gap towards $900, while holding above the middle band would keep the 4-hour structure intact after the breakout from $1,000.

Why is HYPE stalling near $90 even as ETF inflows refuse to turn negative?

Wall Street is pouring into Bitcoin ETFs: why BTC is still trapped below $80,000

Crypto price predictions: Dogecoin, XRP, Venice Token (VVV)

Zcash price prediction: Here’s why ZEC token has gone parabolic

ARB price prediction: How Robinhood Chain growth is boosting Arbitrum
No results found
Loading articles...
Failed to load articles. Please try again.