
Top crypto price predictions today: Pi Network, Pepe Coin, Zcash

AI Sentiment: 35/100 Bearish
This score is generated through AI-driven analysis of the article's content.

powered by

Buy PEPE. The falling wedge often resolves with a strong bullish breakout, and it’s framed as part of a bullish pennant structure. Target a push to ~$0.0000040. Thesis invalidates if PEPE breaks below the lower wedge boundary.
Key Risk: PEPE breaks down out of the falling wedge, turning the pattern into continued downside instead of a breakout.
Sell PI. The rising wedge is nearing convergence and RSI shows bearish divergence while price sits below the 100-day EMA—setup favors a bearish breakout. Target a move back toward ~$0.0716 (YTD low). Thesis invalidates on a clean break above ~$0.1110.
Key Risk: PI’s V27 upgrade hype triggers a sustained breakout above $0.1110, reversing the wedge breakdown.
- Pi Network has formed a rising wedge pattern, pointing to a retreat.
- Zcash price has become highly overbought after the recent rally.
- Pepe Coin price has formed a bullish pennant pattern.
The crypto market remained on edge during the weekend as investors reacted to the elevated crude oil prices and the upcoming Federal Reserve interest rate decision. Bitcoin and Ethereum to $77,000 and $2,500, respectively, while the Crypto Fear and Greed Index has moved to 68. This article provides a forecast for some of the top tokens like Pi Network (PI), Pepe Coin (PEPE), and Zcash ZEC.
Pi Network price prediction
Pi Coin price has moved upwards in the past few days. It has jumped from a low of $0.0715 in July to the current $0.097 as focus remains on the upcoming V27 upgrade. This upgrade will improve its smart contracts features.
Technicals suggest that the coin may be on the cusp of a bearish breakout, potentially to theall-time high. For one, it has formed a rising wedge chart pattern. This pattern is made up of two ascending and converging trendlines.
In most cases, a bearish breakout normally happens when the two lines are about to converge. At the same time, the token remains below the 100-day Exponential Moving Average (EMA), while the Relative Strength Index (RSI) has formed a bearish divergence pattern.
Therefore, the most likely scenario is that the coin forms a bearish breakout, potentially to the year-to-date low of $0.07156. The bearish outlook will become invalidated if it moves above the key resistance level of $0.1110.
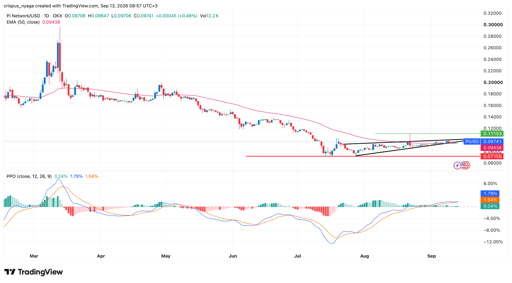
Pi Network price chart | Source: TradingView
Pepe Coin price forecast
Pepe Coin price has done well in the past few months, moving from a low of $0.0000022 in July to a high of $0.000004547 on August 22nd. This rebound coincided with the broader crypto market rally that pushed Bitcoin and Ethereum to the highest levels in months.
Most recently, however, the coin has pulled back to the current $0.000003478. It has formed a falling wedge pattern, which is made up of two descending and converging trendlines. This pattern often leads to a strong bullish breakout.
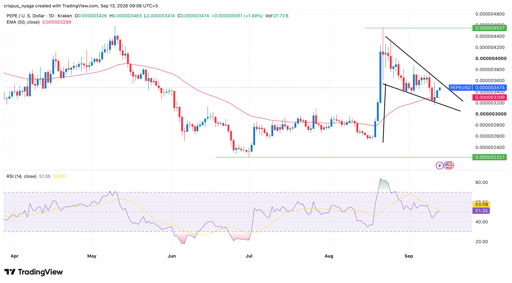
Pepe price chart | Source: TradingView
The falling wedge is part of the bullish pennant pattern, which is made up of a vertical line and a triangle. Therefore, the most likely scenario is where it breaks out higher, potentially to the key resistance level of $0.0000040. The bullish outlook will become invalidated if the coin drops below the lower side of the wedge.
Zcash price prediction
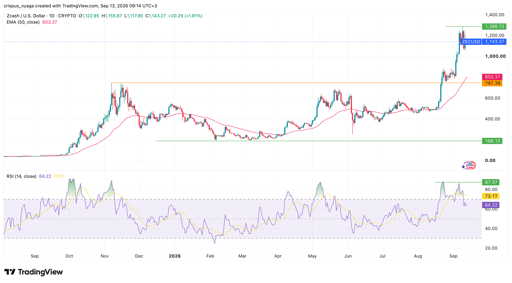
ZEC price chart | Source: TradingView
Zcash price has done well in the past few months. It jumped from the year-to-date low of $188 in January to a record high of $1,288. This surge happened as demand for privacy tokens continued rising. Also, it happened as demand for the recently launched Grayscale Zcash ETF (ZCSH) jumped.
The coin has already crossed the important resistance level of $747, its highest level in November last year. Breaking that level was important because it confirmed the bullish outlook.
The coin has now remained above the 50-day and 100-day moving averages. At the same time, the Relative Strength Index (RSI) has moved from the overbought level of 87 to the current 64. The RSI has formed a double-top pattern. Therefore, the token will likely continue falling, potentially to the support level of $1,000. A move above the year-to-date high of $1,288 will invalidate the bearish outlook.

How will private credit and equity stocks react to Fed rate hikes?

WTI crude oil price forecast as Middle East risks remain elevated: can it hit $120?

Here’s why the Enbridge stock is in a strong downward trend

Here’s why the TripAdvisor stock has crashed to a record low
Here’s why Brent crude oil price is falling today and what's next
No results found
Loading articles...
Failed to load articles. Please try again.