
¿Hasta dónde puede subir ENA tras superar $0.12 con alto volumen?

Sentimiento de IA: 78/100 Alcista
Esta puntuación se genera mediante un análisis impulsado por IA del contenido del artículo.

con tecnología de

Buy ENA. The $0.12 breakout came on heavy volume and followed a month-long range break, and the new $1B FalconX lending facility adds a credible, non-basis return stream for USDe/ENA. Momentum is still constructive while ENA holds above the cleared $0.115 area; upside is a clean path to the 200-day EMA (~$0.1268) and then $0.1366 (2.618 fib).
Riesgo clave: Pérdida rápida del momentum: ENA pierde $0.115 y retrocede al rango anterior, mostrando que la ruptura fue solo un squeeze de corta duración.
Sell ENA perps (or buy ENA puts) to protect against a pullback. The 4-hour RSI is ~91 and price is outside the upper Bollinger Band, which usually means mean reversion risk even if the longer-term story is intact. Use this to monetize volatility while the market digests the news and tests support near $0.115–$0.116.
Riesgo clave: Los compradores siguen presionando y ENA cierra por encima de la EMA de 200 días (~$0.1268), convirtiendo la configuración de sobrecompra en una continuación de la tendencia.
- ENA ha subido más de un 34% en 24 horas.
- Una facilidad de financiación de $1 billion de FalconX ha respaldado el repunte.
- ENA está probando ahora la EMA de 200 días cerca de $0.1268.
El precio de Ethena ha subido más de un 34% en las últimas 24 horas hasta alrededor de $0.125, ampliando su ganancia de siete días a más del 46% mientras los inversores reaccionan a una nueva facilidad de préstamo institucional y a la ruptura de un rango de precios de un mes.
CoinGecko data showed ENA trading near $0.125 on Aug. 21 after rising from around $0.093 over the previous day, while the token's trading activity increased sharply during the move.
FalconX's Aug. 19 announcement of a $1 billion secured warehouse financing facility with Ethena, under which assets backing USDe can be deployed into overcollateralised loans to institutional borrowers.
FalconX said it will originate and service the loans while collateral is held with qualified third-party custodians.
Ethena receives exposure to the loans through a special purpose vehicle, with the structure designed to provide secured institutional credit using capital from assets backing USDe.
Para Ethena, el acuerdo añade otra fuente de rentabilidad junto a las estrategias de base cripto que USDe ha utilizado históricamente.
FalconX said the facility provides access to overcollateralised institutional lending and a return stream outside traditional crypto basis trades.
USDe has relied partly on delta-neutral strategies involving spot crypto positions and short derivatives positions.
Returns from such strategies can change as perpetual futures funding rates move, making the new lending channel another way for Ethena to deploy reserve assets.
The timing of ENA's move is also notable. The FalconX deal was announced on Aug. 19, when ENA remained near the low-$0.09 range, while the strongest part of the rally came over the following two days.
CoinGecko's intraday chart showed ENA breaking above $0.10 and continuing through $0.11 and $0.12 as trading activity increased.
Rather than an immediate one-candle reaction to the announcement, the price move accelerated after ENA cleared the range that had contained it for much of August.
ENA's rally has also been helped by strength across the crypto market.
Bitcoin returned above $75,000 after the US Treasury decided to double purchases of older long-dated government bonds, while renewed attention on US crypto legislation also supported sentiment.
ENA's breakout therefore came as buying returned across major crypto assets, adding momentum to its token-specific catalysts.
Análisis del precio de ENA
The 4-hour ENA/USDT TradingView chart shows momentum at an unusually high level after the breakout.
Véalo a continuación:
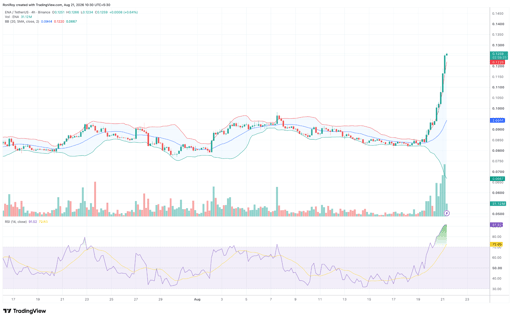
Gráfico de precio ENA/USDT de 4 horas. Fuente: TradingView.
ENA was trading near $0.126 at the time of the chart, compared with a Bollinger Band upper boundary of around $0.122 and a 20-period middle band near $0.0944.
Que el precio cotice por encima de la banda superior de Bollinger confirma la rapidez con la que ENA se ha alejado de su rango reciente, mientras que el ensanchamiento de las bandas muestra cómo la volatilidad se expande junto con el repunte.
The same chart recorded a sharp increase in volume as ENA moved through $0.10, giving the breakout stronger participation than the trading seen during the preceding consolidation.
At the same time, the 4-hour Relative Strength Index had climbed to 91.5, well above the 70 level commonly used to identify overbought conditions. Its RSI moving average stood near 72.8.
Although the readings show strong momentum, they also leave ENA vulnerable to a short-term pullback or sideways period if buyers fail to maintain the current pace.
On the daily chart, ENA has moved above its 20-day EMA at $0.0928, 50-day EMA at $0.0889, and 100-day EMA at $0.0931.
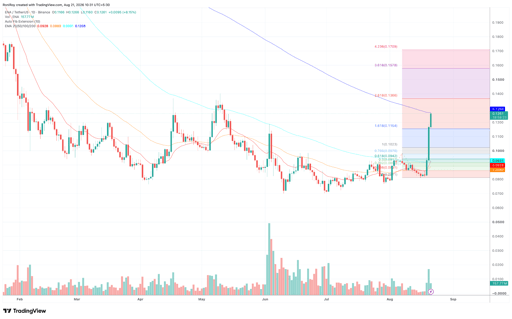
Gráfico de precio ENA/USDT de 1 día. Fuente: TradingView.
La siguiente resistencia se sitúa casi directamente por encima del precio actual, con la EMA de 200 días en torno a $0.1268.
A daily close above the $0.1268 area would put ENA above all four moving averages shown on the chart and could open the next Fibonacci extension levels.
The daily Fibonacci extension places the 2.618 level at $0.1366, making the 0.136-0.137 area the first upside target if ENA clears the 200-day EMA.
Above it, the 3.618 extension at $0.1578 provides a second target, while an extended rally would bring the 4.236 level near $0.1709 into view.
The same Fibonacci structure places the 1.618 extension at $0.1154, a level ENA has already crossed.
If the breakout loses momentum, 0.115-0.116 could therefore become the first area to watch on a retracement, followed by the previous breakout region around 0.102-0.098.
With the 4-hour RSI already above 90 and price outside the upper Bollinger Band, ENA remains stretched in the short term.
A move towards $0.1366 would likely require the token to hold above the recently cleared $0.115 area and secure a daily break above the 200-day EMA at $0.1268.

XRP se dispara tras compra de 300M por ballenas: ¿subirá a $1.50?

Bitcoin supera los $74K; una señal podría frenar el avance hacia $80K

Bitcoin llamado 'una de las mejores coberturas' — otra vez

Bitcoin supera $72K: por qué BTC sube 6% mientras Wall Street flaquea

BMNR sube al recuperarse Ethereum; BitMine se acerca a punto de inflexión
No se encontraron resultados
Cargando artículos...
Failed to load articles. Please try again.