Bitcoin reclaims $81K as traders await Trump-Xi China talks

AI Sentiment: 68/100 Bullish
This score is generated through AI-driven analysis of the article's content.
powered by
Buy spot Bitcoin (BTC-USD). Hot CPI + Iran risk keeps rates/inflation uncertainty elevated, and the market is positioning for a Trump–Xi trade deal headline. BTC reclaiming $81K and holding above the 50/100-day EMAs signals buyers are back; the next upside catalysts are a daily close through the 200-day EMA (~$82,037) and then $83,437 (61.8% fib).
Key Risk: Trump–Xi talks disappoint or escalate trade tensions, triggering a risk-off move that breaks $80,000 and forces BTC back below the 50/100-day support zone.
Buy exposure via spot Bitcoin ETF shares (e.g., iShares Bitcoin Trust/IBIT or similar). The article shows institutional wait-and-see via ETF outflows while price dipped under $80K; the thesis is that a positive China-trade headline flips flows back to inflows, which typically amplifies spot demand and lifts BTC faster than spot-only momentum.
Key Risk: ETF outflows persist despite price strength—institutions keep selling, so BTC rallies stall under the $82K–$84K supply zone.
- Momentum indicators remain bullish, indicating that buyers are still in control.
- Investors are focusing their attention on President Trump's visit to China.
- Bitcoin could overcome the $82,000 resistance level if the rally persists.
The cryptocurrency market is recording improved performance on Wednesday following a poor start to the week.
Bitcoin, the leading cryptocurrency by market cap, is trading above $81,000 on Wednesday amid accelerating US inflation risks driven by the Iran war and US President Donald Trump’s travel to China.
Traders are focusing on the trip to China as diplomatic talks between the two countries could be key to the market’s performance in the coming days.
All focus on Trump’s visit to China
Bitcoin has reclaimed the $81,000 level on Wednesday after briefly dropping below $80,000 the previous day.
The positive performance comes as US President Donald Trump will visit China to meet President Xi Jinping.
Trump will be accompanied by industry leaders, including Elon Musk and Jensen Huang, CEO of NVIDIA.
Trump said the discussion will mainly focus on trade and not the Iran war. The president added that,
“We’re either going to make a deal, or they’re going to be decimated one way or the other,” clarifying his stance on Iran.
On Tuesday, the US Consumer Price Index came in hot, with a 3.81% Year-on-Year (YOY) rise and a 2.75% rise in CPI ex-food and energy (YoY).
The data indicates that rising oil prices linked to the US-Iran war and the blockade of the Strait of Hormuz are causing inflation in the country.
While altcoin ETFs recorded inflows on Tuesday, Bitcoin ETFs recorded outflows, suggesting that institutional investors are adopting a wait-and-see approach.
Spot Bitcoin ETFs recorded an outflow of $233 million on Tuesday, resulting in Bitcoin’s temporary dip below $80,000.
Bitcoin price forecast
The BTC/USD 4-hour chart remains bullish as Bitcoin has reclaimed the $81,000 level.
At press time, BTC is trading at $81,200, above the 50-day and 100-day Exponential Moving Averages (EMAs), clustered in the mid-$76,000s.
However, the rally remains capped by the 200-day EMA near $82,037, which is acting as the overhead supply zone.
Bitcoin is also trading above the 50% retracement at roughly $78,962, indicating that the dips remain supported.
The momentum indicators are flashing bullish signals thanks to the latest buys.
The Relative Strength Index (RSI) on the daily chart around 62 hints at firm but not yet overbought upside momentum.
Meanwhile, the Moving Average Convergence Divergence (MACD) has slipped slightly into negative territory, suggesting that there could be a pause or shallow consolidation before the rally continues.
If the rally persists, bulls would see immediate resistance at the 200-day EMA around $82,037, with the 61.8% Fibonacci retracement near $83,437 next.
A daily candle close above these levels would bring the more substantial resistance at $84,410 into focus in the near term.
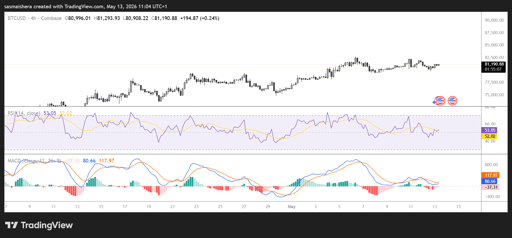
On the downside, initial support lies at the psychological $80,000 level. Failure to defend this level would see sellers push BTC lower towards the 50% retracement at $78,962.
The 100-day and 50-day EMAs are near $76,735 and $76,421, respectively, and could also serve as support levels if the selling pressure persists.

Can Dogecoin hold $0.07 as Iran shock keeps crypto traders nervous?

Solana bulls defend $76 as fading inflows threaten another breakdown

Is Hyperliquid’s HYPE rally cracking as $32M transfer rattles bulls?

XRP’s $1 defence faces a brutal test as ETF demand starts to crack

Ethereum rebounds from $1,700, but weak buying keeps bulls on edge
No results found
Loading articles...
Failed to load articles. Please try again.