Akash Network price prediction: $0.8 in focus as AKT price stabilises

AI Sentiment: 62/100 Bullish
This score is generated through AI-driven analysis of the article's content.
powered by
Buy Akash Network (AKT) for a range-to-breakout setup. The token is consolidating between $0.7356–$0.7996 after a +63.8% 30-day run, with most indicators still bullish and long-term EMAs stacked below price. Entry is strongest on a hold/retest of ~$0.74–$0.76, targeting a reclaim and daily hold above $0.8, then push toward $0.9. Thesis: consolidation is profit-taking, not trend break.
Key Risk: AKT loses $0.6767 support and starts a deeper selloff, proving the consolidation was a trend break.
Sell/short AKT if it fails to reclaim $0.8. The $0.8 area is the near-term decision point and the 30-day SMA is acting as resistance, with repeated rejections in the upper range. Trigger: rejection at ~$0.79–$0.80 followed by a breakdown back under ~$0.7356. Target the lower end of the range and then $0.6767. Thesis: resistance holds and profit-taking accelerates without a catalyst.
Key Risk: AKT breaks and holds above $0.8 (and especially a daily close toward $0.9360), invalidating the rejection thesis.
- AKT fell 3.4% in 24h after a 64% monthly rally.
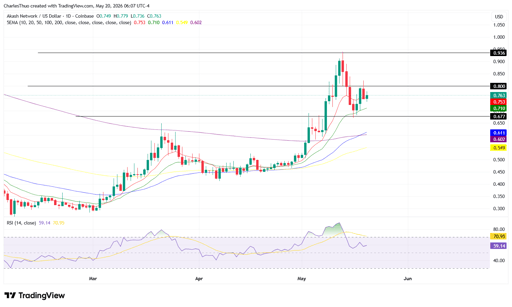
- Key support sits at $0.6767, with $0.8 acting as a pivot zone.
- AKT price remains above all major EMAs, keeping the trend structure bullish.
Akash Network is showing signs of stabilisation after a volatile week that saw the token ease from recent highs.
At the time of writing, AKT trades around $0.7538, reflecting a 3.4% decline over the past 24 hours and a 13.4% drop over the past seven days.
Despite the short-term weakness, the broader structure suggests the token is still holding a larger upward trend that began over the past month.
The latest move comes after a strong rally phase where AKT gained approximately 63.8% in 30 days, pushing the price into a zone where profit-taking has now become more visible.
This cooling-off phase has kept the token in a tight range between $0.7356 and $0.7996 over the last 24 hours, with traders closely watching whether the $0.8 level can be reclaimed and held.
Profit-taking slows momentum after strong monthly rally
The recent pullback is largely tied to profit-taking activity following the sharp monthly rise.
AKT’s climb of nearly 64% in 30 days created conditions where short-term traders began locking in gains, especially in the absence of new, immediate catalysts strong enough to extend the rally further.
Market behaviour also shows a divergence between short-term price action and technical signals.
While the token has dropped over the past week, 12 out of 23 technical indicators remain bullish, compared to only 2 bearish signals, with the rest sitting neutral.
This imbalance suggests that selling pressure has not fully overturned the broader technical structure.
The token is also trading below its 30-day simple moving average, which has now turned into a short-term resistance level.
This has contributed to repeated rejection attempts near the upper part of the recent range, reinforcing the idea that the market is currently in a consolidation phase rather than a breakout phase.
Technical structure still supports broader bullish trend
Despite the recent decline, longer-term technical indicators continue to show strength.
AKT is currently trading above all major exponential moving averages, including the 10-day, 20-day, 50-day, 100-day, and 200-day EMAs, which remain stacked below the current price.
This alignment is often viewed as a sign that the underlying trend is still upward despite short-term corrections.
The RSI at 59.14 places momentum in neutral territory, showing that the market is neither overbought nor oversold, leaving room for movement in either direction depending on how the price reacts around key levels.
From a technical perspective, the next important resistance level is at $0.9360, which would need a decisive daily close above it to signal continuation of the broader upward move.
On the downside, key support is located at $0.6767, which has been identified as the level that must hold to avoid a deeper correction phase.
Longer-term outlook remains tied to trend stability
Looking at the wider market structure, AKT remains far below its previous cycle high of $8.07, recorded in April 2021.
The long gap since that peak highlights the extended recovery phase the token has been undergoing, spanning several years of price compression and cyclical movement.
Forecast models for 2026 place a wide range of outcomes, with projections extending toward approximately $4.70 on the higher end and around $0.45 on the lower end.
This wide spread reflects the uncertainty in long-term adoption and market conditions surrounding decentralized compute infrastructure.
For now, the focus remains on whether AKT can stabilise above its short-term support levels and rebuild momentum toward the $0.8–$0.9 region, where the next structural breakout decision is likely to form.

ONDO price jumps 10%: did FINRA just unlock its biggest US opportunity?

TRX tests $0.33 resistance: is Tron's gasless payment boom enough?

XRP’s AI boom hits one million transactions, but the price tells another story

Ethereum price slips below $1,900: is a deeper breakdown about to begin?

HYPE price remains below $60: has the recovery already lost its edge?
No results found
Loading articles...
Failed to load articles. Please try again.