Can Ethereum hold $1,700 as exchange inflows pressure ETH bulls?

AI Sentiment: 28/100 Bearish
This score is generated through AI-driven analysis of the article's content.
powered by
Use options to monetize the asymmetric downside: leverage is being cut and longs are getting liquidated on breaks below $1,800, while spot demand is weak (ETF outflows, subdued new addresses). Buy ETH downside protection with a focus on $1,700 (near the current battleground). If $1,700 fails, the move toward $1,384 should accelerate and option value expands quickly.
Key Risk: A sharp risk-on reversal drives ETH back above $1,800 and keeps it pinned near/above $1,700, causing rapid time decay and loss of put value.
Exchange inflows to Binance (~57.7k ETH) plus rising “Age Consumed” (older coins moving, some at realized losses) signals supply hitting spot just as leverage and futures positioning are shrinking (open interest down ~31%, leverage ratio down to 0.83). With US spot ETH ETF outflows still running (17-day streak) and macro/risk-off headwinds, $1,700 is a fragile support test. Sell ETH now and target a retest of $1,384, then $1,289–$1,071 if support breaks.
Key Risk: ETH reclaims and holds above $1,800 and then breaks through the $2,400–$2,600 overhead supply zone, flipping the flow/positioning narrative to accumulation.
- Ethereum continues to defend the $1,700 support area.
- RSI recovery on daily timeframe points to fading sell-side momentum.
- Resistance remains overhead despite strong volume support.
Ethereum has remained pinned near the $1,700 level after exchange inflows climbed, futures activity contracted, and traders continued reducing leveraged exposure across the market.
According to CryptoQuant analyst Pelin Ay, Binance has recorded net inflows of roughly 57,700 ETH in recent days, adding fresh supply to the market at a time when new demand remains subdued.
The analyst noted that only around 320 new addresses have recently deposited ETH, a figure that trails participation levels seen during previous buying waves.
Large transfers to exchanges often attract attention because they can precede selling activity.
Binance, as one of the largest sources of spot liquidity in the crypto market, has become a focal point for traders assessing whether additional downside pressure could emerge if Ethereum attempts another recovery.
Recent on-chain activity has added to those concerns, as Ethereum's "Age Consumed" metric has risen sharply, indicating that older, previously inactive coins have been moved on-chain.
A portion of those transfers reportedly occurred at realized losses, suggesting some long-term holders exited positions during the latest downturn.
While exchange balances increased, Ethereum's supply issuance remained relatively restrained.
Daily issuance currently stands near 2,791 ETH, a level that remains low compared with historical periods before Ethereum's EIP-1559 upgrade.
Derivatives activity falls as traders cut leverage
Beyond spot markets, derivatives data points to a noticeable reduction in speculative participation.
Ethereum futures open interest has declined to $10.3 billion (approx. €9 billion) from approximately $15 billion (approx. €13.1 billion) a month ago, representing a drop of about 31%, according to Ay.
The Aggregate open interest has also fallen to its lowest level since April 2025.
A similar pattern has appeared in leveraged positioning. The estimated leverage ratio fell to 0.83 after reaching an all-time high of 1.10 on June 2. The decline ranks among the largest leverage reductions seen since late 2025.
Such moves often indicate traders are becoming less willing to take aggressive directional bets.
In Ethereum's case, the reduction in leverage has removed a source of buying power that previously helped support rebounds.
Recent market action also exposed how vulnerable leveraged positioning had become.
As ETH slipped below the closely watched $1,800 level, long positions accumulated around that area were forced out of the market.
These liquidations added selling pressure and accelerated the decline toward the mid-$1,600 range.
Institutional flows have offered little support during that period.
Market data showed US spot Ethereum ETFs experienced a prolonged 17-day streak of net outflows, which is another source of demand that had previously helped absorb selling from the spot market.
Although the pace of withdrawals has started to slow, the extended outflow period has left market depth weaker than what was seen earlier this year.
Macroeconomic conditions remain another variable.
Higher-for-longer interest rate expectations, persistent strength in the US dollar, and risk-off sentiment across financial markets have reduced appetite for speculative assets.
At the same time, Ethereum has faced weaker decentralized finance activity, lower lending volumes, and declining decentralized exchange activity, while the ETH/BTC pair continues to trend lower.
Ethereum price analysis points to a critical support test
Ethereum's price structure continues to place attention on the $1,700 area.
The asset has lost roughly 30% over the past six weeks and remains close to a demand zone identified by analysts between $1,700 and $1,400.
The April 2025 low at $1,384 remains the nearest major downside liquidity target if support fails.
On the daily chart, Ethereum’s visible range volume profile shows one of the most significant trading clusters around the current price region, suggesting buyers and sellers have historically conducted substantial business near these levels.
See below:
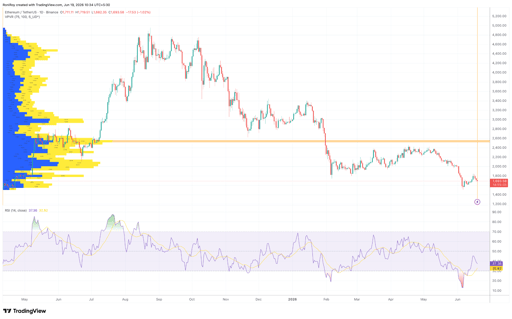
ETH/USD 1-day price chart. Source: TradingView.
Heavy volume concentration around current prices often strengthens support because many market participants have established positions there.
Meanwhile, Ethereum's daily RSI has recovered to around 37 after previously falling below 20 during the recent selloff.
The indicator has crossed above its moving average and is climbing from oversold territory, signaling that downside momentum has eased.
According to crypto analyst Ardi, several technical signals suggest Ethereum could be nearing a market bottom.
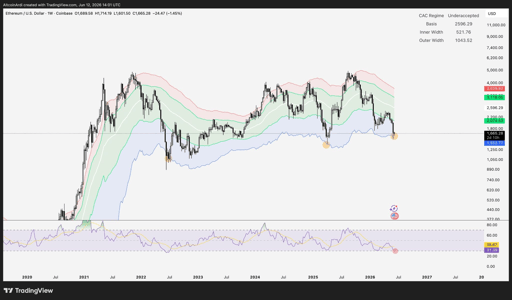
ETH/USD price chart. Source: Ardi on X.
The analyst pointed to ETH's recent test of the lower edge of a long-term acceptance range that has historically aligned with major cycle lows.
Ardi also highlighted a weekly RSI reading near 31 after the daily RSI fell to a record low of 11 during the latest selloff, arguing that the current price zone could support a bottoming process.
However, Ethereum’s daily RSI remains below the neutral 50 level, while price continues to trade beneath a sequence of lower highs established since late 2025.
Volume profile data also identifies a major overhead supply zone between roughly $2,400 and $2,600.
Any sustained recovery would likely need to overcome that region before a larger trend reversal could develop.
For now, analysts continue to view the $1,400 to $1,700 range as the market's key battleground.
Holding above that area could strengthen the case for a prolonged accumulation phase.
A decisive break lower would place the April low near $1,384 back into focus, followed by a longer-term demand region between $1,289 and $1,071 that dates back to early 2023.

Injective price forecast: Coinbase integration strengthens bullish case for INJ

Bitcoin price outlook: treasury sell-offs, Poolin bankruptcy and $1.2B options expiry

How high can BEAT go as whale withdrawals drain exchange supply?

ONDO price jumps 10%: did FINRA just unlock its biggest US opportunity?

TRX tests $0.33 resistance: is Tron's gasless payment boom enough?
No results found
Loading articles...
Failed to load articles. Please try again.