Ethereum’s 5-year gains vanish as analysts eye $4,630 rebound path

AI Sentiment: 35/100 Bearish
This score is generated through AI-driven analysis of the article's content.
powered by
Buy ETH (spot) for a range-to-breakout setup: defend ~$1,700 and reclaim ~$1,760 (back above the 20-day MA). If it holds, next resistance is $1,800–$1,850, then $2,000. The article shows RSI recovering from oversold and consolidation in $1,700–$1,750, which often precedes a directional move.
Key Risk: ETH breaks and holds below ~$1,680, triggering a slide toward $1,500 then $1,300/$1,060 support.
Sell/short ETH on failed strength: fade bounces into $1,800–$1,850 where the chart repeatedly rejects and ETH remains below the 50/100/200-day moving averages. Use a tight thesis window: if price can’t reclaim $1,850, odds favor another leg down through $1,500 and toward $1,300.
Key Risk: ETH decisively breaks above $1,850 and starts holding it, forcing a trend reversal toward $2,000 and higher targets.
- Ethereum has held above $1,700 as analysts debate its next major move.
- RSI has improved, though ETH remains below major moving averages.
- Buyers need to reclaim $1,800 to strengthen the recovery case.
Ethereum has traded near its March 2021 price level, leaving analysts divided between a long-term accumulation opportunity and the risk of another leg lower toward key support zones.
According to CoinGecko data, Ether changed hands at around $1,730 at publication time, up roughly 0.5% over the previous 24 hours after fluctuating between $1,708 and $1,742.
Despite several major rallies and selloffs over the past five years, the asset has returned to almost the same level where it traded in early 2021.
Data shared by market analyst Ali Martinez highlighted that Ethereum was valued at roughly $1,700 in March 2021 and remains close to that area today.
Ethereum $ETH is trading at roughly the same price it was in March 2021.
— Ali Charts (@alicharts) June 20, 2026
This means a $10,000 investment made five years ago would still be worth approximately $10,000 today.
Despite five years of severe volatility, explosive bull runs, and deep bear-market liquidations, ETH… pic.twitter.com/JGLoIU4hJd
Based on that comparison, a hypothetical $10,000 investment made at that time would still be worth about the same amount today, despite the asset reaching record highs and later giving back those gains.
Martinez noted that Ethereum has produced no net appreciation from that starting point after years of volatility.
For traders watching the current range, the key question is whether the market is building a durable floor or simply pausing before another decline.
Even after the prolonged downturn, Ethereum retains a market capitalisation above $200 billion (approx. €174.5 billion), keeping it among the largest digital assets by value.
Price performance, however, has become a growing focus as investors weigh technical conditions against Ethereum's long-term adoption story.
Analysts split between recovery and deeper correction
Looking ahead, Martinez identified $1,060 as an important value zone should Ethereum lose higher support levels.
A move into that region would represent a much deeper retracement and could become an area where long-term investors reassess demand.
On the upside, the analyst said Ethereum would first need to defend current support before attempting a recovery toward $2,850 and later $4,630.
The higher target sits near the area where ETH previously established its all-time high.
A separate chart shared by market commentator KNIGHT outlined a more cautious scenario.
In that outlook, Ethereum faces repeated rejection near the $1,800 to $1,850 region before gradually falling through support zones around $1,500, $1,300 and potentially $1,060.
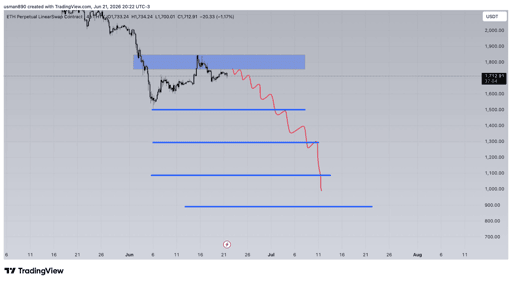
Ethereum price chart. Source: KNIGHT on X.
Any price projection remains an analyst's personal scenario rather than a prediction, though it aligns with support levels already highlighted by Martinez.
Offering a different perspective, crypto analyst Michaël van de Poppe argued that current conditions may represent one of the better long-term accumulation periods for Ethereum.
According to van de Poppe, investors could eventually look back and view current prices as attractive entry points over a five-to-ten-year horizon.
While those views support a bullish long-term thesis, Ethereum still faces the challenge of reclaiming resistance levels that have capped recent advances.
Ethereum price analysis
Recent price action has shown some stabilization after a sharp selloff earlier this month.
Over the past week, ETH briefly climbed above $1,830 before sellers regained control and pushed the asset toward the $1,680 area.
Since then, the price has recovered modestly and spent several sessions trading between roughly $1,700 and $1,750.
On the daily chart, Ethereum remains below its 20-day, 50-day, 100-day and 200-day moving averages.
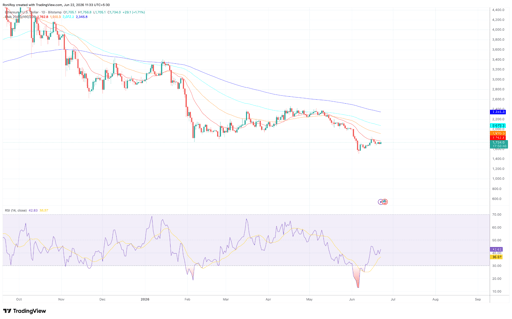
ETH/USD 1-day price chart. Source: TradingView.
The 20-day moving average currently sits near $1,763, while the 50-day, 100-day and 200-day averages are positioned around $1,910, $2,072 and $2,346.
Such positioning shows that the primary trend remains under pressure despite the recent rebound.
Momentum indicators have improved slightly.
Daily RSI has recovered from oversold territory to around 43, suggesting selling pressure has eased, though buyers have yet to regain full control as the indicator remains below the neutral 50 level.
On the four-hour chart, Ethereum is trading close to the middle Bollinger Band near $1,718, while the upper and lower bands sit near $1,750 and $1,687.
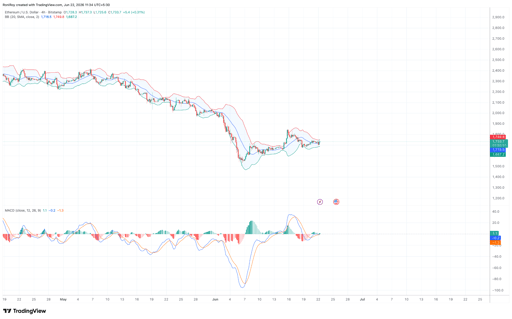
ETH/USD 4-hour price chart. Source: TradingView.
Price has spent several days consolidating inside that range after recovering from its June low.
The MACD indicator on the same timeframe has flattened around the zero line, showing neither side currently holds a decisive advantage.
Until a breakout occurs, traders are likely to watch the Bollinger Band boundaries for the next directional move.
A push above $1,760 would place Ethereum back above its 20-day moving average and could expose the $1,800 to $1,850 resistance zone.
If buyers manage to establish support above that area, attention could shift toward $2,000 and eventually the higher targets discussed by Martinez.
Failure to hold the current range would place $1,680 under renewed pressure.
A break below that level could bring $1,500 back into focus, followed by $1,300 and the $1,060 zone identified by analysts as a major support area.
Binance outflows draw attention
Separately, CryptoQuant analyst Rei Researcher reported a notable increase in Ethereum outflows from Binance during June 2026.
According to the analyst, a significant amount of ETH left the exchange while the asset traded near the $1,710 area.
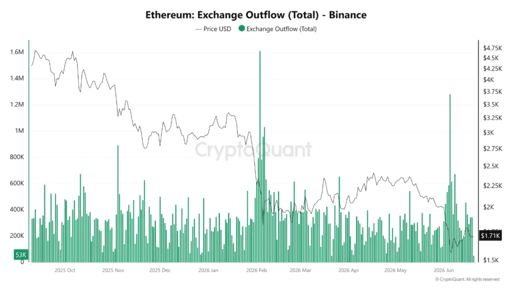
Ethereum Binance outflows. Source: CryptoQuant.
Exchange outflows are often interpreted as a sign that investors are transferring assets into private wallets or staking platforms rather than preparing them for immediate sale.
When sustained, such activity can reduce available exchange supply and ease selling pressure.
However, Rei Researcher cautioned that outflows alone do not guarantee higher prices. Market demand, macroeconomic conditions, and Bitcoin's performance continue to influence Ethereum's direction.
At the moment, Ethereum remains caught between improving short-term momentum and a longer-term downtrend.
Buyers have defended the $1,700 area in recent sessions, but analysts continue to watch resistance near $1,800 and support levels below $1,500 before declaring the next major move.

Injective price forecast: Coinbase integration strengthens bullish case for INJ

Bitcoin price outlook: treasury sell-offs, Poolin bankruptcy and $1.2B options expiry

How high can BEAT go as whale withdrawals drain exchange supply?

ONDO price jumps 10%: did FINRA just unlock its biggest US opportunity?

TRX tests $0.33 resistance: is Tron's gasless payment boom enough?
No results found
Loading articles...
Failed to load articles. Please try again.