
Bitcoin price warning: Iran shock puts $60,000 support back in focus

AI Sentiment: 18/100 Bearish
This score is generated through AI-driven analysis of the article's content.

powered by

Sell BTCUSD (spot or perpetuals) while it’s below the 50/100/200-day EMAs and failing to reclaim $64,004. The article flags bearish EMA alignment and a likely retest of $60,000 if weakness continues; next downside magnets are $61,242 TLQ, then $59,522 and $57,710 if that breaks.
Key Risk: A clean breakout and hold above $64,004 that flips momentum and forces a fast reclaim of the 50-day EMA ($65,578).
Short Brent crude (Brent futures or USO-style oil exposure) as a hedge against the “Iran shock” driving risk-off and weakening global growth sentiment. The article notes Brent jumped to ~$75 on the same escalation; if BTC keeps sliding, that usually coincides with fading energy-driven risk premiums and a pullback in oil.
Key Risk: Further escalation that keeps Brent bid (oil stays elevated or rises again), offsetting the BTC risk-off move.
- Bitcoin is under selling pressure after failing to reclaim $64,000 resistance level.
- BTC continues to trade below its 50-day, 100-day, and 200-day EMAs.
- With stable momentum indicators, buyers must overcome key resistance levels.
Bitcoin BTC continued to weaken on Wednesday as sellers maintained control following the cryptocurrency's rejection near the $64,000 level.
The latest decline extends the ongoing corrective phase, with the world's largest cryptocurrency remaining trapped beneath several major technical resistance levels.
At the time of writing, Bitcoin is trading around $62,825, keeping the short-term trend tilted to the downside.
Bitcoin trades below key EMAs
Bitcoin has lost nearly 1% of its value in the last 24 hours and has dropped below the $63,000 level.
The bearish performance comes after the United States military executed strikes against Iran on Wednesday in retaliation for three ships attacked by Tehran in the Strait of Hormuz.
The renewed tension could violate the Islamabad Accord and weigh on global markets.
Due to the attack, Brent crude oil price reached $75 on Wednesday, following a 5% jump the previous day.
Meanwhile, Bitcoin is underperforming. The leading cryptocurrency by market cap is trading below its 50-day, 100-day, and 200-day Exponential Moving Averages (EMAs), positioned at $65,578, $69,226, and $75,229, respectively.
This alignment of key moving averages highlights persistent bearish sentiment and suggests that any recovery attempts may continue to face strong selling pressure.
If the bearish trend persists, a reversal in BTC threatens to retest the $60,000 psychological threshold. If that happens, it could nullify the previous double-bottom reversal thesis.
Bitcoin price outlook: Technical indicators show limited bullish momentum
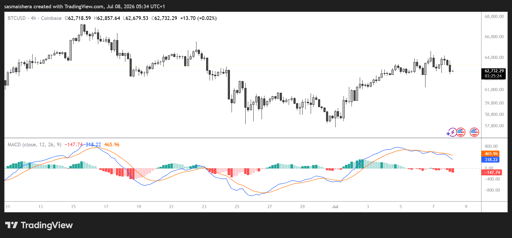
The BTC/USD 4-hour chart remains bullish despite Bitcoin’s poor performance so far this week.
Despite the recent weakness, momentum indicators offer mixed signals.
The Relative Strength Index (RSI) is hovering around 49, indicating neutral market conditions with neither buyers nor sellers holding a decisive advantage.
Meanwhile, the Moving Average Convergence Divergence (MACD) remains in positive territory, with the MACD line still above the zero level.
This suggests bullish momentum has not disappeared entirely, although it remains relatively weak and insufficient to reverse the prevailing downtrend.
Overall, technical indicators point to cautious optimism, but Bitcoin will likely need stronger buying volume before confirming a meaningful recovery.
If the bulls regain control, the first obstacle for Bitcoin bulls sits near the $64,004 horizontal resistance level, where the cryptocurrency recently faced rejection.
A successful breakout above that zone would bring the 50-day EMA at $65,578 into focus, creating another significant hurdle for buyers.
Beyond that, Bitcoin would need to overcome the 100-day EMA at $69,226 and the 200-day EMA at $75,229 before challenging the longer-term resistance around $84,410.
Until these resistance levels are reclaimed, the broader technical structure continues to favor sellers, leaving Bitcoin vulnerable to additional downside if support levels begin to fail.
However, if the bearish trend persists, Bitcoin could drop below $62,000 and test the 4-hour Transactional Liquidity (TLQ) area at $61, 242.
Failure to defend this support level could expose lower demand zones at $59,522 and $57,710 in the near term.

Why is XRP falling even as ETF money keeps flowing into the market?

Why is Ethereum stuck below $2,500 even as ETF inflows stay strong?

Is Bitcoin’s $80,000 wall about to crack, or are whales ready to sell?

Bitcoin holds near $80K as Fed hike bets rise, ETF inflows continue

Solana targets $120 as ETF inflows and network activity rise
No results found
Loading articles...
Failed to load articles. Please try again.