
Uniswap jumps 5% as one metric signals the rally may have more room

AI Sentiment: 72/100 Bullish
This score is generated through AI-driven analysis of the article's content.

powered by

Buy Uniswap (UNI) spot. The catalyst is real activity: UNI handles ~58% of EVM stablecoin-to-stablecoin swaps and leads weekly DEX volume. Price action confirms: UNI is above the 50-day EMA and momentum is positive (MACD > signal). With the 200-day EMA at ~$3.90 as the next trigger, a clean break can run UNI toward the prior swing high near $4.20. Key risk: UNI fails to clear the ~$3.90 200-day EMA and RSI stays overheated (around 74), triggering a sharp pullback back below the 50-day EMA (~$3.10).
Key Risk: Breakout fails at the 200-day EMA and UNI mean-reverts below the 50-day EMA.
Buy UNI perpetuals (or UNI long exposure via a liquid futures/perp product). Second-order setup: rising open interest (+6%) with positive funding (0.0076%) means new longs are being added, not just short covering—so if price holds above ~$3.50 and grinds toward ~$3.90, forced momentum buying can accelerate as more traders chase the breakout. This is the “crowd builds, then price confirms” effect. Key risk: funding flips negative or price rejects ~$3.90, causing long liquidation and a fast unwind.
Key Risk: Funding turns against longs and a rejection at ~$3.90 triggers liquidation.
- Uniswap (UNI) has gained nearly 5%, extending its three-day recovery to $3.5.
- Protocol captured 58% of all stablecoin-to-stablecoin swap volume over past month.
- Breakout above 200-day EMA at $3.90 could pave the way for an extended rally.
Uniswap UNI surged by nearly 5% on Friday, extending its recovery for a third consecutive session as the decentralized exchange (DEX) continues to benefit from rising on-chain activity and growing trader confidence.
The token remains comfortably above its 50-day Exponential Moving Average (EMA), while increasing stablecoin trading volume and stronger derivatives activity point to improving market sentiment.
However, bulls still need to overcome key technical resistance near the 200-day EMA before a larger rally can unfold.
Uniswap leads stablecoin trading across DeFi
Uniswap continues to strengthen its position as the leading decentralized exchange for stablecoin trading.
According to the protocol, it processed 58% of all EVM stablecoin-to-stablecoin swap volume over the past 30 days, underscoring its dominant role in decentralized finance (DeFi).
Uniswap processed 58% of all EVM stable ⇄ stable volume in the last 30 days
— Uniswap (@Uniswap) July 9, 2026
Stablecoins move on 🦄 pic.twitter.com/HXooN42mB0
Higher stablecoin trading activity typically reflects deeper liquidity, lower trading costs, and improved capital efficiency across the platform, making Uniswap increasingly attractive for traders and liquidity providers.
Data from DeFiLlama further highlights the protocol's strength, with Uniswap recording approximately $8.7 billion (approx. €7.6 billion) in decentralized exchange trading volume over the past seven days, outperforming major competitors such as PancakeSwap and Pump.fun.
The sustained growth in trading activity reinforces confidence in Uniswap's ecosystem and supports long-term demand for the UNI token.
Retail sentiment has also improved in the derivatives market.
According to CoinGlass, UNI futures Open Interest (OI) increased 6% over the past 24 hours to approximately $244.8 million (approx. €213.5 million), indicating that traders are opening new leveraged positions.
The positive sentiment is reinforced by a funding rate of 0.0076%, suggesting that long-position holders are willing to pay a premium to maintain bullish exposure.
The combination of rising open interest and positive funding rates typically reflects growing confidence among speculative traders that UNI could continue its upward trend.
UNI price forecast: Can bulls break above the 200-Day EMA?
The UNI/USD 4-hour chart is bullish and efficient as Uniswap is currently trading around $3.50, maintaining a positive short-term outlook after reclaiming several important technical levels.
The recent rally has seen Uniswap surpass the 50-day Exponential Moving Average (EMA) at $3.08.
Despite the recent gains, the 200-day EMA near $3.90 remains the most significant resistance level.
A successful breakout above this area could allow UNI to challenge its previous swing high around $4.20.
Momentum indicators continue to favor buyers, although signs of overheating are beginning to emerge.
The Relative Strength Index (RSI) has climbed to 74, placing UNI in overbought territory and suggesting the rally may pause or consolidate in the near term.
Meanwhile, the Moving Average Convergence Divergence (MACD) remains firmly in positive territory, with the MACD line holding above its signal line, indicating that bullish momentum remains intact.
If the buyers remain in control, they will be watching the 200-day EMA at $3.90 as the next major hurdle.
A decisive close above that level could accelerate gains toward the previous swing high near $4.20.
On the downside, initial support is located around $3.10, where the 50-day EMA converges with a key retracement level.
A pullback toward this zone could attract fresh buying interest if the broader uptrend remains intact.
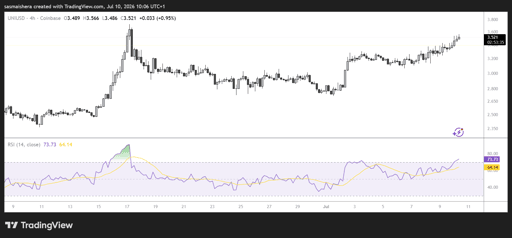
With Uniswap maintaining its dominance in stablecoin trading and derivatives activity pointing to growing retail optimism, the outlook for UNI remains constructive.
However, bulls must overcome the resistance cluster above $3.90 to confirm the next leg of the recovery.

Crypto stocks MARA, COIN, Strive, MSTR rally as a bull run starts, but risks remain

Ethereum gains 25% as ETF demand strengthens after record $3B short wipeout

Crypto rally today: Why are XRP, Dogecoin, Cardano, Pepe going up?

Bitcoin surges past $76K as buyers pile in: is real demand taking over now?

SOL surges past $90 as ETF flows turn stronger: is a run toward $100 underway?
No results found
Loading articles...
Failed to load articles. Please try again.