
LIT price explodes 10%: is whale buying setting up another breakout?
AI Sentiment: 78/100 Bullish
This score is generated through AI-driven analysis of the article's content.

powered by

Buy Lighter (LIT) spot. Whale wallet added ~3.38M LIT and the token burn is now revenue-funded (buybacks in open market before permanent burns), so demand should track platform activity. Chart confirms trend shift: reclaim of 20/50/100/200-day EMAs, bullish MACD, daily RSI ~57 (not overheated). Target $2.60–$2.70 next; add on holds above $2.34–$2.20 support.
Key Risk: Whale buying stops and the burn/revenue link disappoints—price falls back below the $2.20–$2.34 breakout support.
Buy LIT perpetuals (or go long via the most liquid perp) for a momentum continuation trade. The rally formed higher highs/higher lows and shorts were pressured during consolidation; if $2.43 breaks, funding/positioning can chase the move and accelerate upside toward $2.60–$2.70.
Key Risk: A sharp rejection at $2.43 that triggers a fast unwind—price drops back under $2.34 and momentum flips.
- LIT has jumped nearly 10% in 24 hours.
- Whale accumulation has fueled fresh buying.
- Bullish technical indicators point to sustained momentum.
Lighter LIT has climbed nearly 10% over the past 24 hours, outperforming a largely muted cryptocurrency market as whale accumulation, an upcoming token burn, and ecosystem updates have driven fresh buying interest.
According to CoinGecko data, LIT traded around $2.36 at the time of writing after gaining about 9.7% over the previous 24 hours, outperforming most major cryptocurrencies.
The token briefly touched $2.43 during the rally before easing slightly, while Bitcoin and several large-cap digital assets posted comparatively modest moves.
Market participants have tied much of the latest momentum to a highly visible accumulation campaign by a large on-chain wallet that has attracted attention across crypto social media.
Multiple on-chain tracking accounts reported that a whale wallet accumulated approximately 3.38 million LIT, valued at roughly $7.37 million, over the past day.
The purchases were widely shared on X, prompting traders to monitor the address as it continued building its position.
Activity from the same wallet did not stop with completed purchases. Blockchain observers also noted that the address received another $5.5 million worth of USDS and USDC, leading traders to speculate that additional buying capacity remained available.
LIT has become the wallet's largest reported altcoin position, adding to expectations that further accumulation could continue if prices remain attractive.
Visibility around the purchases quickly spilled into derivatives and spot markets.
Traders attempting to position ahead of potential follow-up buying entered the market near the $2.00-$2.20 area, contributing to stronger spot demand while also putting pressure on short positions that had formed during the recent consolidation.
Although whale buying helped attract attention, investors have also pointed to changes in Lighter's token economics that could reduce circulating supply over time.
Last month, Lighter announced a transition to a revenue-funded permanent token burn model, replacing its previous structure with a mechanism that uses protocol revenue to repurchase LIT from the open market before permanently removing the tokens from circulation.
The first major event under the new framework removed approximately 15.5 million LIT, equal to about 6.3% of the circulating supply.
According to the protocol, the burn will be funded using revenue generated during the second quarter, creating a direct connection between platform activity and token supply.
Because the buybacks occur in the open market before tokens are burned, many traders view the mechanism as creating sustained demand whenever protocol revenue grows.
Rather than relying on scheduled emissions or treasury allocations, future burns are tied to actual trading activity on the platform.
Another catalyst arrived on July 31, when Lighter introduced an updated referral program designed to expand user participation.
Under the revised system, eligible users can receive up to 30% of a referee's trading fees back in USDC.
Since trading fees help finance the protocol's buyback-and-burn mechanism, the referral changes have been interpreted by many market participants as a way to increase platform activity while simultaneously supporting future token repurchases.
The combination of new tokenomics and visible whale accumulation has created multiple catalysts within a short period, giving traders both a fundamental and speculative narrative to follow.
Price action over the past day has mirrored that change in sentiment.
LIT advanced steadily from roughly $2.16 before accelerating during the early hours of Aug. 7. Instead of producing a single vertical spike, the rally developed through a series of higher highs and higher lows before reaching an intraday peak near $2.43.
Some profit-taking emerged after the move approached that level, but buyers defended the $2.34-$2.36 area, allowing the token to retain most of its daily gains.
The ability to hold above previous breakout levels has kept attention on whether momentum can continue over the coming sessions.
LIT price analysis: What do the charts show?
The daily chart presents a constructive long-term picture.
Using the Visible Range Volume Profile (VPVR), the largest historical trading activity remains concentrated around the $1.55-$1.60 region. See below.
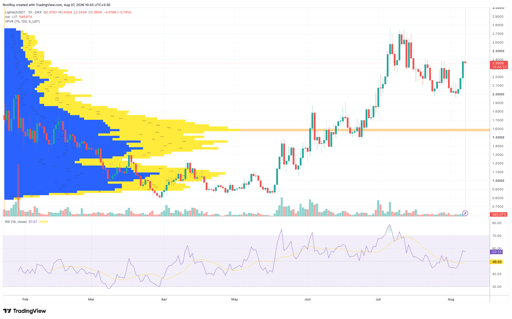
LIT/USDT 1-day price chart. Source: TradingView.
Since LIT is now trading well above that high-volume node, the chart suggests buyers have accepted higher prices following the breakout from earlier consolidation.
Above current levels, comparatively lighter historical trading activity remains until the region around $2.60-$2.70, where previous selling pressure became more pronounced.
If buying momentum continues, that area could become the next significant resistance zone.
Momentum indicators also point to improving conditions without showing signs of overheating.
The Relative Strength Index (RSI) on the daily timeframe has recovered to around 57, placing it above the neutral 50 level while remaining below traditional overbought territory near 70.
Such a reading indicates momentum has strengthened compared with recent weeks but still leaves room for additional upside if buying interest persists.
On the 4-hour chart, LIT has reclaimed its 20-day, 50-day, 100-day and 200-day exponential moving averages, with the shorter averages now positioned above the longer ones.
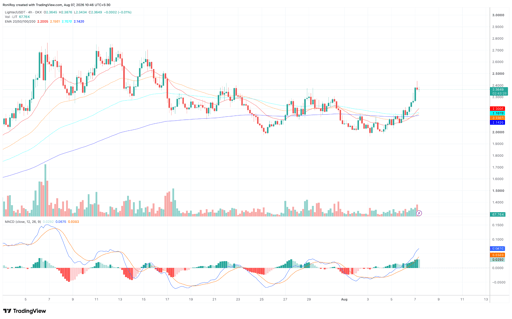
LIT/USDT 4-hour price chart. Source: TradingView.
This alignment often indicates improving trend strength after a breakout.
Meanwhile, the MACD has completed a bullish crossover, while the histogram continues expanding into positive territory.
The indicator points to increasing upward momentum following the latest recovery from the early August lows.
Price is also trading comfortably above the clustered moving averages between roughly $2.14 and $2.20, creating a nearby technical support zone should short-term pullbacks develop.
If buyers maintain control above current levels, traders may watch the recent swing high near $2.43 as the first barrier.
A decisive move above that level could open the way toward the $2.60-$2.70 resistance region identified on the daily VPVR chart.
Conversely, failure to hold above $2.34-$2.20 could encourage profit-taking toward the moving-average cluster, although the broader technical structure would remain constructive as long as price stays above the key support created during the recent breakout.

PURR stock price forecast as Hyperliquid’s HYPE token hits a record high

Bitcoin ETFs keep buying, so why is BTC still stuck below $80K?

Why XRP traders are watching $1.47 as Evernorth and ETF demand build pressure

ENA explodes 10% as Ethena moves to kill its biggest token overhang

Can Ethereum price reclaim $2,500 as ETF demand battles profit-taking?
No results found
Loading articles...
Failed to load articles. Please try again.