
AMD stock forms a rare bullish pattern as valuation concerns persist

AI Sentiment: 68/100 Bullish
This score is generated through AI-driven analysis of the article's content.

powered by

Buy AMD. The stock is breaking out of a bullish flag/inverted head-and-shoulders setup, reclaiming the 50/100-day EMAs and pushing toward $584 then $600. Fundamentals back it: Q2 revenue +50%, data center up strongly, and Q3 revenue guidance around $13B. The $4.75B bond funding to buy ZT Systems supports continued server/data-center momentum, which is where the multiple can stay elevated.
Key Risk: AMD fails to keep growth and margins ahead of expectations, so the premium valuation (forward P/E ~68) compresses fast.
Buy NVDA and MARVELL as a momentum follow-through. If AMD’s breakout holds, investors typically rotate within AI/data-center semis toward the whole group—especially names with strong earnings visibility. NVDA is already priced for growth (forward P/E ~25), and MARVELL’s valuation is high but can re-rate with sector strength.
Key Risk: The market de-risks semis (rates/AI demand scare), and the group sells off together regardless of individual charts.
- AMD stock has formed a bullish flag pattern on the daily chart.
- The company has raised $4.75 billion in bond offering to fund its ZT buyout.
- There are concerns about the company’s valuation metrics.
AMD stock has held steady in the past few days and is slowly nearing the year-to-date high of $584. It was trading at $514.40 on Monday and has formed a bullish flag pattern, pointing to more upside despite the elevated concerns about its valuation.
It jumped on Monday after offering details of its $4.75 billion bond offering, which are spread across four tranches spread between 2029 and 2036. It will use these funds to buy ZT Systems, a top company in the server industry.
AMD stock has formed a bullish flag pattern
Technicals suggest that the Advanced Micro Devices stock has more upside in the near term. It has jumped above the 50-day and 100-day Exponential Moving Averages (EMA), a sign that the uptrend is continuing.
The stock has formed a giant bullish flag pattern, which is made up of a vertical line and a descending channel. The price has moved close to the upper side of the channel.
AMD has moved above the Supertrend indicator. Also, a closer look shows that the stock has formed an inverted head-and-shoulders pattern, a common bullish continuation sign in technical analysis.
Therefore, the stock will likely continue rising, with the next key target to watch being the year-to-date high of $584, the year-to-date high. A move above that level will point to more gains, potentially to the psychological level of $600.
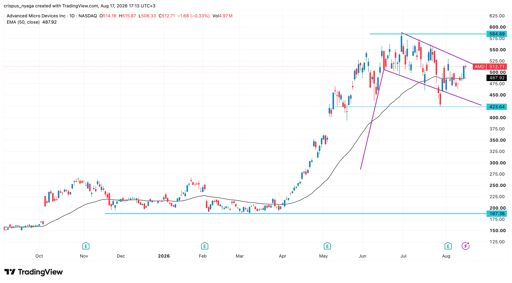
AMD stock chart | Source: TradingView
AMD’s business is growing
The most recent earnings showed that AMD’s business continues to grow this year as demand for GPUs and CPUs rise. Its revenue jumped by 50% in the second quarter to $11.5 billion, with its data center segment more than doubling to $6.7 billion.
The embedded revenue soared by 19% to $977 million, with the client & gaming segment making $3.8 billion. The data center business growth was accompanied by a 1,457% increase in its operating income.
AMD, like other top semiconductor companies, boosted its forward guidance as its customers continue spending. It now expects that its third-quarter revenue will jump to $13 billion, plus or minus $300 million. At its midpoint, this growth would represent a 41% annual increase.
Analysts are also optimistic about AMD’s growth, with the most optimistic one being $14 billion. Also, they expect the EPS to come in at $1.93, up sharply from last year’s $1.2. The next two annual revenues are expected to come in at $50 billion and $87 billion.
Still, a key risk is that AMD has become a highly overvalued company. For example, it spots a forward non-GAAP price-to-earnings ratio of 68, much higher than the technology sector median of 24. Its GAAP multiple is 90, also much higher than the technology sector median.
In contrast, Nvidia, which is growing at a faster rate than AMD, spots a forward P/E ratio of 25. Marvell Technologies has a multiple of 54.
The same is true for other multiples, with its forward EV-to-EBITDA and price-to-free cash flow being 61 and 106, respectively. A DCF calculation also shows that the company is not a bargain, meaning that it will need to justify this premium valuation.
On the positive side, AMD is balancing its strong growth with margin expansion. Its forward revenue growth is 40%, while its net income margin is 15%. This figure brings its Rule-of-40 multiple to 55%, which is considered safe. However, this valuation metric is mostly ideal for companies in the software industry.

Why is SpaceX stock rallying today?

Strategy (MSTR) stock rises 3% as company raises $333M through share sale

Alibaba stock rises on report Lingxi Games to be sold for $2B
DRAM: Here’s why this Micron, SanDisk, Western Digital ETF is soaring

Mizuho names the top 2 REITs worth owning in 2026
No results found
Loading articles...
Failed to load articles. Please try again.