
Lululemon stock forecast: why it may crash below $100 soon

AI Sentiment: 12/100 Bearish
This score is generated through AI-driven analysis of the article's content.

powered by

Sell LULU. Fundamentals are rolling over (revenue growth from ~30% to ~5%, Americas down, China slowing, net income down). Even with a lower forward P/E (~10.5), the article flags “value trap” risk. Chart confirms bear control: below $159 support, below 50-week EMA, bearish flag into a horizontal channel—setup for a breakdown toward $100 and then $80.
Key Risk: Lululemon proves a real turnaround fast (clear guidance re-accelerating growth and margins), causing the stock to reclaim $159 and invalidate the breakdown path.
Sell NKE as a high-conviction peer trade. The article shows the whole industry is in a synchronized drawdown (Nike down ~50% in 12 months, ~77% in 5 years). If Lululemon is struggling with demand and profitability, Nike’s brand-led demand and inventory cycle risk likely keeps pressure on the group, especially if consumers keep trading down.
Key Risk: Nike delivers a sharp demand/inventory correction with strong forward guidance that lifts the whole discretionary apparel complex and forces multiple expansion.
- Lululemon stock has underperformed the US equities market.
- The company’s Americas and Chinese markets are slowing.
- It has formed a bearish flag pattern, pointing to further downside.
Lululemon stock continues to underperform the broader market as the company’s and industry’s challenges continue. LULU is down by 44% this year and by 71% in the last five years, a dramatic reversal for a company that was once one of the most popular among retail and institutional investors.
LULU’s retreat has coincided with that of other top companies in the industry. Nike stock has dropped by 50% in the last 12 months and by 77% in the last five. In Germany, Adidas has fallen by 50% in the last five years, while On Holding is down by 33% in the same period.
Lululemon Athletica is facing pressure in key areas
Lululemon, a company whose business boomed during the pandemic, has done well in the past few years as its growth trajectory has stalled.
It has moved from having double-digit growth to single digits. In 2023, the company’s revenue growth was nearly 30%, a figure that dropped to 4.8% last year.
The most recent results showed that its net revenue rose by just 4% in the first quarter to $2.5 billion or 2% on a constant-dollar basis.
Most notably, its key markets are no longer doing well. Its Americas revenue dropped by 3%, a notable development since it is its most profitable.
Its international segment’s revenue jumped by 22% in the quarter, with its comparable sales rising by 13%. While these growth metrics are good, they are much lower than where they were a few quarters ago. Mainland China’s revenue has also slowed drastically in the past few months.
The company’s profits have also plunged. Its net income dropped to $195 million in the first quarter from $314 million in the same period last year.
Lululemon’s growth is expected to be minimal in the coming years. The average estimate among analysts is that its second-quarter revenue will be $2.46 billion, down by 2.55% from a year earlier. For the year, its revenue is expected to drop by 0.54% to $11.04 billion, followed by a modest growth next year to $11.34 billion.
Therefore, the company’s valuation has become a bargain. Its forward price-to-earnings ratio dropped to 10.5, lower than the consumer discretionary median of 17, and the five-year average of 28. Despite its cheap valuation, there is a possibility that it may be a value trap. Unless the company demonstrates a clear turnaround strategy, the stock will likely continue falling.
Lululemon stock technical analysis
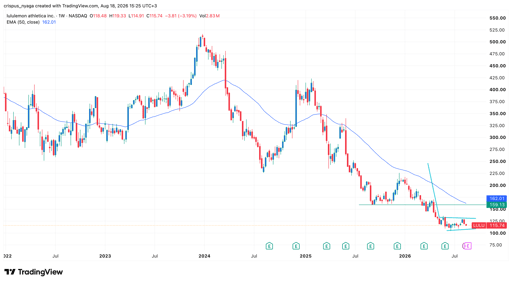
LULU stock chart | Source: TradingView
The weekly chart shows that the LULU stock has been in a strong sell-off for a while. It has slumped below the important support level of $159, its lowest level in September and November last year.
Lululemon stock has slumped below the 50-week Exponential Moving Average (EMA), a sign that bears remain in control. The stock has formed a bearish flag pattern and is now in the horizontal channel.
Therefore, the stock will likely continue falling, potentially to the key support level of $100. A move below that support will point to further downside towards $80.

Is Oracle stock a buy before earnings as analysts turn bullish?

Apple to release folded iPhone this week: what to expect

Wall Street is about to lose a $1.1 trillion buyer: why stocks could get bumpier

Lloyds share price forms a risky pattern as insiders sell, risky pattern forms

Vodafone share price: Technicals point to a jump to 135p as turnaround continues
No results found
Loading articles...
Failed to load articles. Please try again.